Types of Graphs — Line Graph, Bar Graph, and Pie Graph Explained for Data Visualization
Graphical representation of data is one of the most powerful tools in analysis, communication, and decision-making because it transforms raw numbers into patterns that can be visually recognized within moments. Whether in academic research, business reporting, scientific analysis, education, economics, medical studies, or everyday observations, graphs help people understand trends, compare categories, identify proportions, and observe relationships that would be difficult to detect from tables and text alone. Three of the most commonly used and universally understood graph types are the line graph, the bar graph, and the pie graph, and each one conveys information differently based on the nature of the dataset. A deeply detailed understanding of these graph types reveals not only their surface-level function but also the underlying logic that determines when and why each format is appropriate, what patterns it reveals most clearly, and how data visualization strengthens interpretation and communication.
Line Graphs — Visualizing Trends, Change, and Continuity Over Time
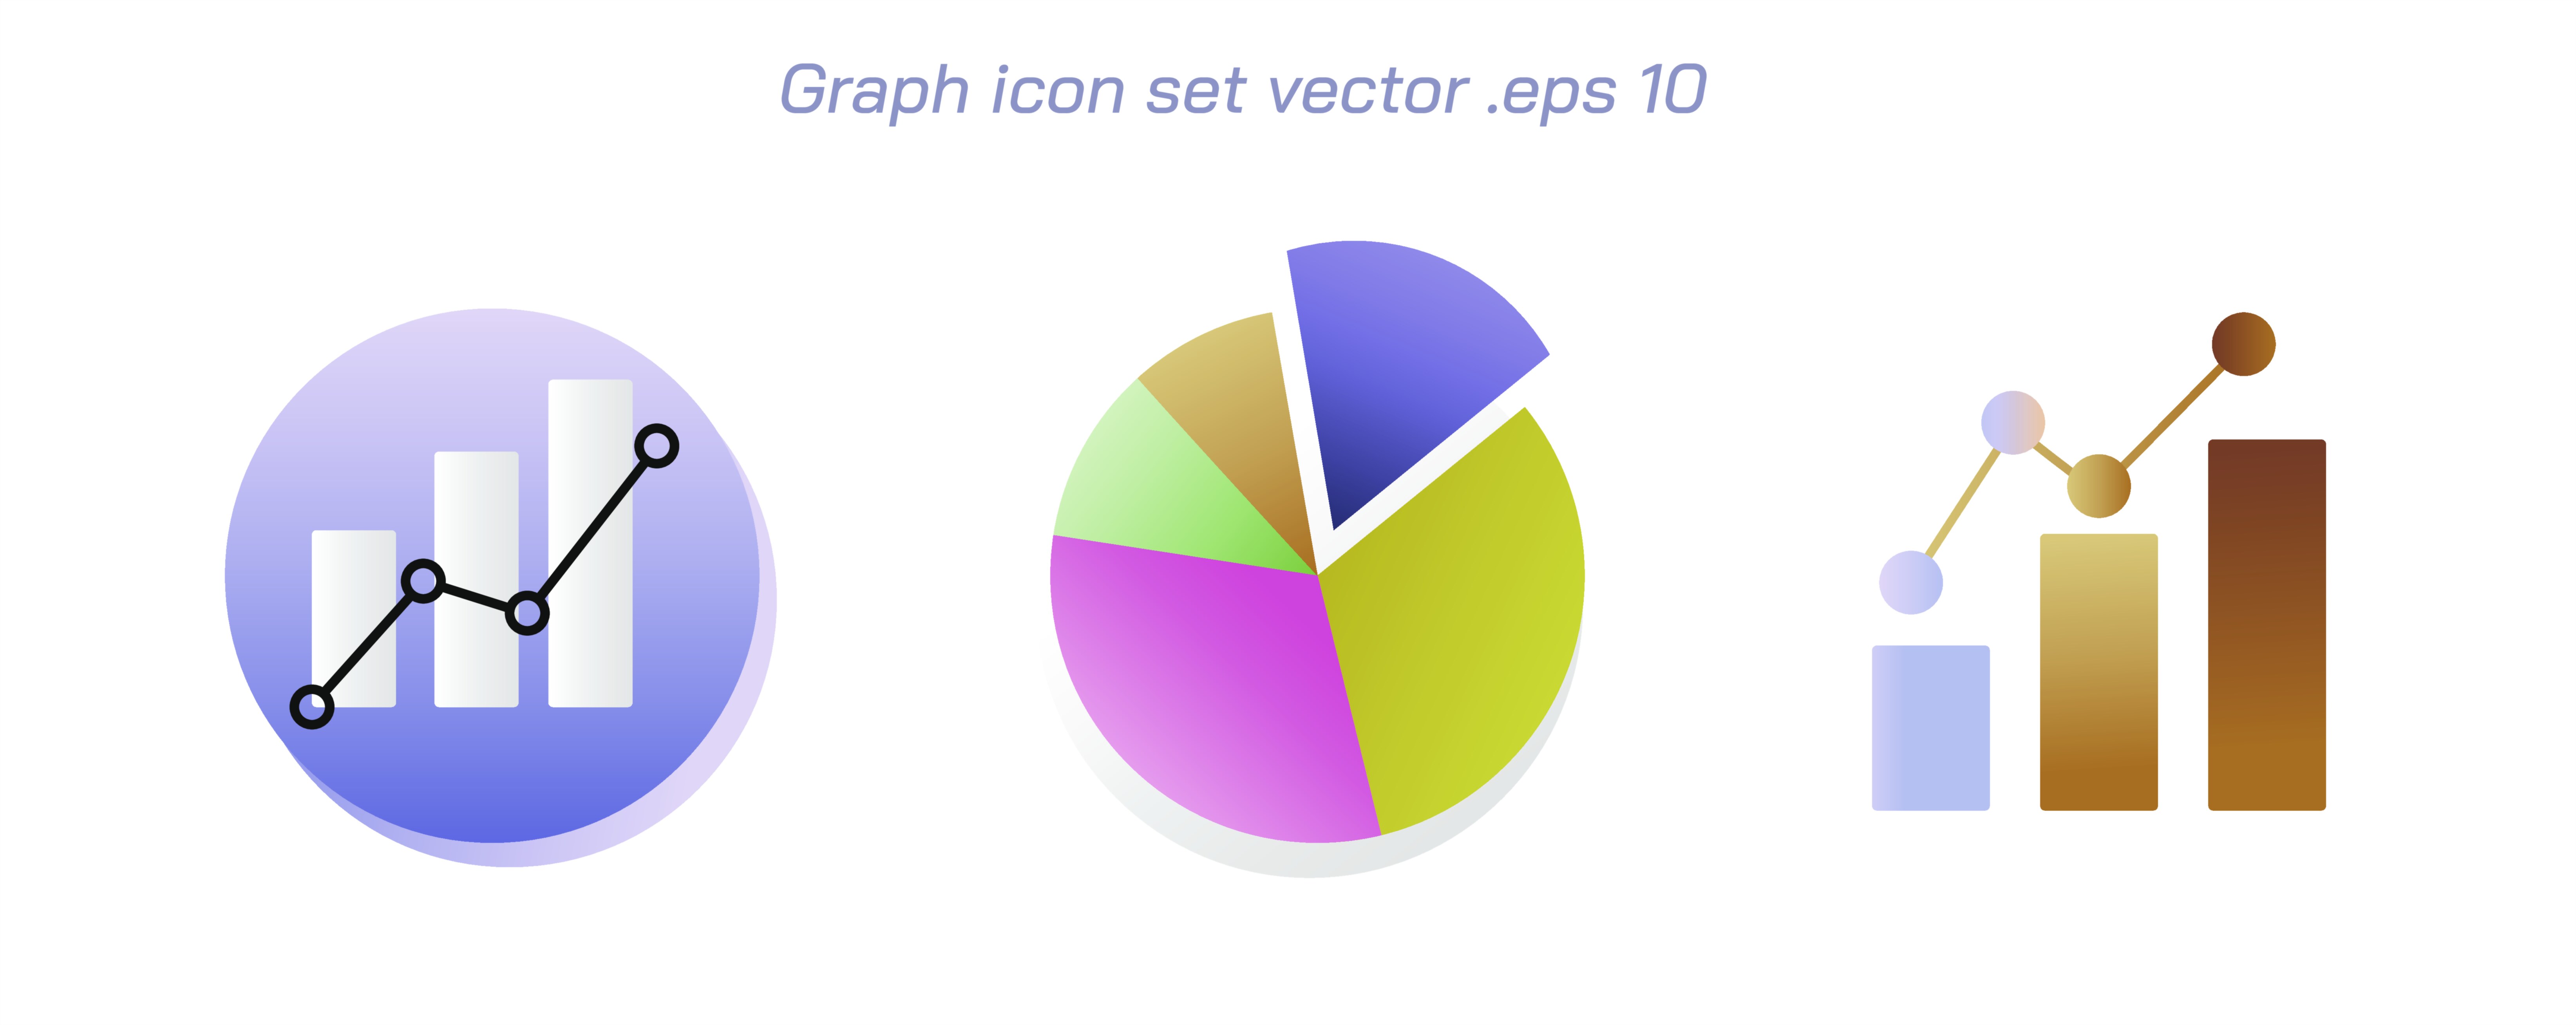
A line graph is designed to display data that changes continuously, especially across time or an ordered sequence. The power of this representation lies in its ability to show how a value increases, decreases, or fluctuates rather than presenting the magnitude alone. Each data point on a line graph corresponds to a measurement, and these points are connected by straight segments to form a continuous path that represents the evolving behavior of the variable. This path creates a visual impression of movement, rhythm, and direction that the human eye naturally follows. For example, a line graph is ideal for tracking the rising and falling temperature throughout the day, monitoring stock market prices over weeks, measuring rainfall across months, recording student progress across school terms, or examining population growth across decades. What makes the line graph particularly meaningful is not only that it shows the final value of the dataset but that it helps compare where the value started, where it increased sharply, where it plateaued, and where it declined. The graph offers a chronological narrative of change, and this narrative is much easier to understand visually than numerically.
The line graph also excels in comparing multiple related trends on a single plane. When multiple lines share the same axes, viewers can see whether different variables follow similar patterns, diverge, intersect, or respond differently to the same conditions. For example, a comparison of monthly sales for different products, temperature changes of multiple cities, or exam score progression among different students becomes immediately intelligible when multiple lines are plotted. The ability to detect patterns of correlation and divergence arises naturally, not through calculations but through visual perception. Every point and slope on a line graph reveals information: steeper slopes represent sharper change, flatter slopes indicate stability, and peaks and troughs identify highest and lowest points. In this way, the line graph becomes a storytelling tool that visually captures how time influences the rise and fall of values.
Bar Graphs — Comparing Quantities Across Categories with Clear Visual Contrast
A bar graph represents data using rectangular bars of equal width but varying height (or length, in horizontal form), allowing clear comparison of different categories without implying continuity. Unlike line graphs, bar graphs do not connect points to show progression; instead, they emphasize magnitude by presenting each category as an independent value. The bars provide an instant sense of dominance, deficiency, equality, or contrast among groups. A bar graph is ideal for comparing the number of students in different grades, the production of various factories, the population of different countries, or the monthly revenue of different businesses when order does not signify continuity. The visual height of each bar communicates value instinctively—viewers do not need complex reasoning to understand that a taller bar corresponds to a larger quantity.
Bar graphs can also show grouped or stacked structures to add depth to comparison. Grouped bar graphs place multiple bars for each category side-by-side, enabling a comparison of sub-categories without losing the comparison between major categories. Stacked bar graphs combine sub-categories inside a single bar, using segments to show how parts contribute to a whole while still allowing comparison between categories. This versatility makes the bar graph extremely useful in business dashboards, scientific reports, demographic studies, resource allocation planning, and financial summaries. Whether the bars appear vertically or horizontally, the underlying principle remains the same: the direct visual contrast in lengths or heights helps people interpret numerical difference intuitively, without needing deep statistical skills. Because of this clarity, bar graphs often serve as the foundation for presentations aimed at decision-makers, audiences, or students for whom quick understanding is essential.
Pie Graphs — Representing Parts of a Whole Through Proportional Segments
A pie graph, also known as a pie chart, represents a complete dataset as a circle divided into slices where each slice corresponds to a category’s share of the total. The meaning of the pie graph lies in the visual proportionality of its segments: larger slices represent larger contributions, while smaller slices represent smaller contributions. The viewer sees instantly not only how much each category accounts for individually but also how categories relate to each other as components of a unified whole. Pie graphs are perfect for situations where the most important question is how a total divides into parts. Examples include showing the percentage distribution of household expenses across categories like food, rent, utilities, and transport; the market share of different companies within an industry; the distribution of time spent on daily activities; or the composition of a school’s student population across grade levels.
The circular shape of the pie graph reinforces the idea of completeness—every slice is an inseparable part of a fixed total. Even audiences unfamiliar with numerical statistics can detect relationships: if one slice visually dominates the others, it immediately signals which category occupies the greatest share. Similarly, if two slices appear nearly identical, viewers understand that the corresponding categories are highly comparable. Pie graphs may also include exploded slices, where one segment is pulled outward to highlight a category of special importance. Labels, percentage markers, and color differentiation further enhance interpretation. These features make the pie graph especially effective in communication contexts such as reports, infographics, product breakdown sheets, performance summaries, and surveys where understanding proportional distribution is more meaningful than recognizing exact numeric values.
Choosing the Right Graph — Understanding the Relationship Between Data and Visualization
The line graph, bar graph, and pie graph may appear superficially similar because they all display data in visual form, but the deeper logic behind when to use each type depends on the structure of the dataset and the question being asked. A line graph excels when the emphasis is on change over time or the behaviour of variables across an ordered sequence. A bar graph is best suited for comparisons between independent categories where the order of categories does not imply progression. A pie graph is optimal when the goal is to illustrate how portions contribute to a complete total and when relative proportions are more important than precise values.
These graphs also illuminate different types of relationships. Line graphs help identify trends, growth patterns, seasonal fluctuations, and long-term movements. Bar graphs reveal differences, ranking, and performance contrasts across distinct categories. Pie graphs highlight dominance, balance, and distribution across components within a single dataset. By choosing the correct graph, one strengthens not only visual clarity but also cognitive understanding, making data easier to interpret accurately.
Ultimately, data visualization is not about decoration but about enhancing meaning. The line graph offers a visual narrative of change, the bar graph provides a comparative measurement across categories, and the pie graph presents a proportional breakdown of a whole—each one transforming raw numbers into insight. In this way, graphs serve as bridges between data and comprehension, showing that effective visualization is not merely a display technique but a method of thinking. When used appropriately, these foundational graph types allow data to tell a story—one that supports clearer reasoning, stronger communication, and better-informed decisions across disciplines and everyday life.