Growth and Decay Illustration: Exponential Increase and Decrease in Mathematics and Science Explained
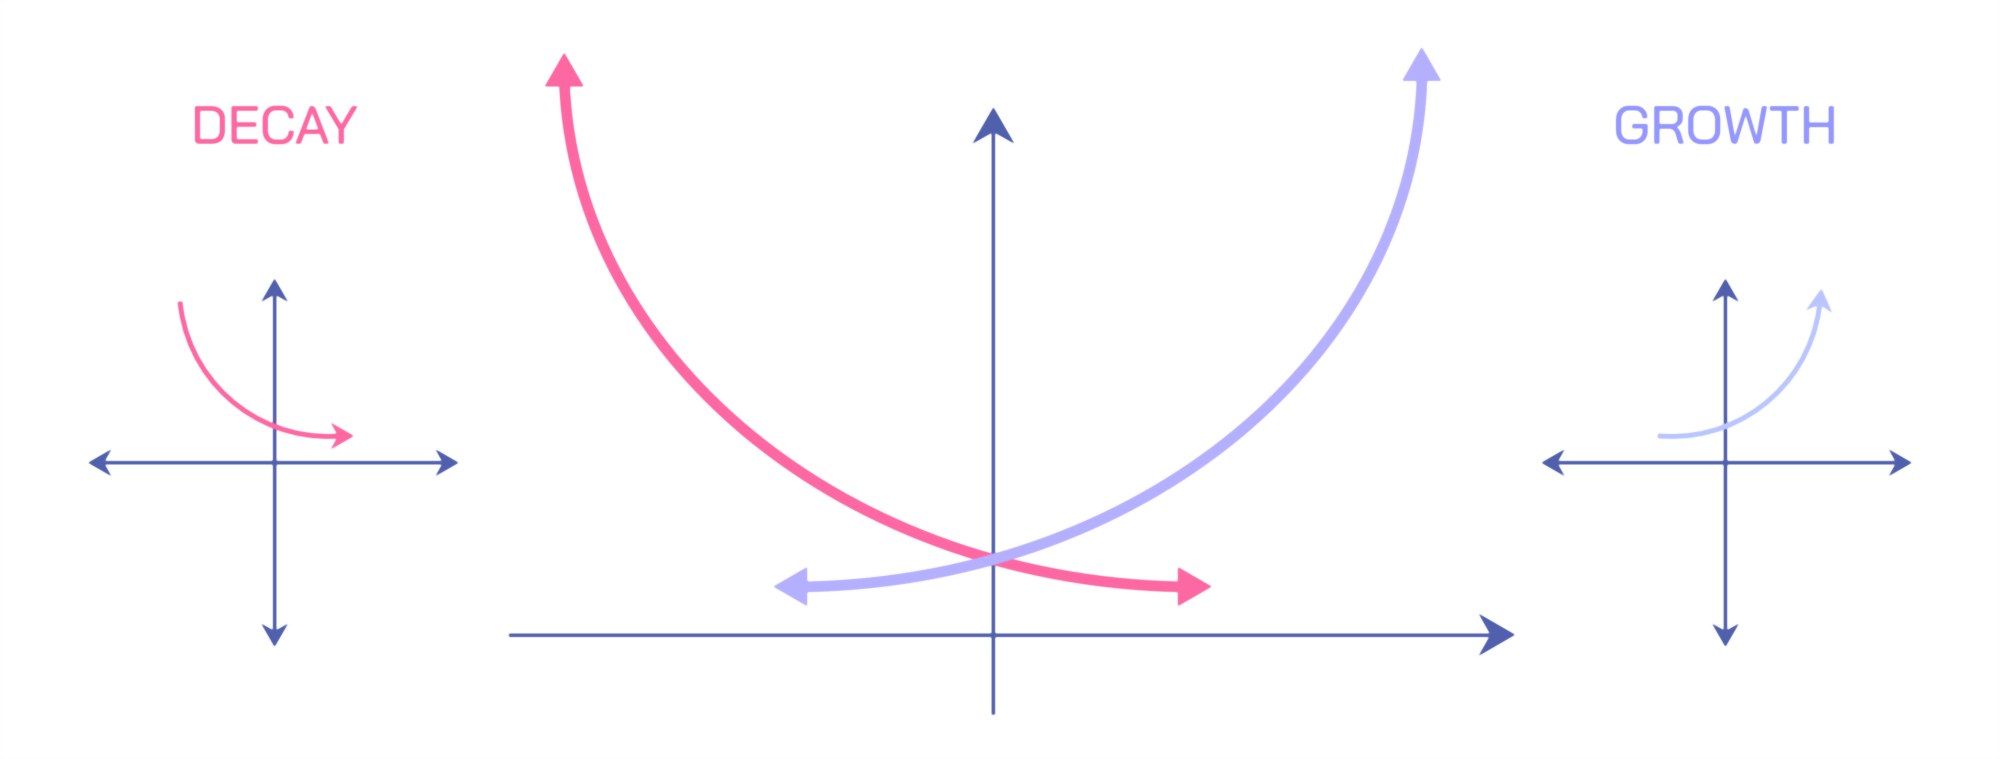
Exponential growth and exponential decay are two of the most influential mathematical patterns found throughout nature, science, economics, and technology, and an illustration comparing them visually captures how systems can expand or diminish at rates far faster than linear intuition might suggest. At the conceptual level, exponential change occurs whenever the rate of increase or decrease of a quantity is proportional to its current size. This means that as something grows, it grows faster because there is more of it to expand, and as something decays, it shrinks faster because there is less of it remaining to sustain the process. In a visual diagram, exponential growth is often portrayed as a curve that begins slowly and then rises sharply upward, while exponential decay begins rapidly but then tapers smoothly toward zero. Both curves have a distinctive sweeping shape that immediately differentiates them from straight-line (linear) patterns.
The most common illustration of exponential growth begins with a graph showing time on the horizontal axis and the growing quantity on the vertical axis. At early points on the curve, progress appears modest; the initial steps of growth are small and gradual. However, as time continues, each increment becomes larger than the last because the process compounds. In practical examples, exponential growth appears in populations where each generation adds more organisms than the previous one, in the adoption of new technologies where social influence accelerates usage, and in compound interest where money accumulates at a faster rate the more wealth has already accumulated. Illustrations sometimes include a doubling ladder—1, 2, 4, 8, 16, 32—demonstrating that each stage builds on the previous one. The upward curvature becomes especially dramatic in long-term projections, helping explain why exponential growth can transform from almost invisible change into sudden rapid escalation.
In contrast, exponential decay shows the opposite pattern: a rapid initial decrease followed by steadily slowing decline. Graphs of exponential decay often display quantities such as radioactive isotope mass, medication concentration in the bloodstream, or the cooling of a hot object. The function drops sharply at the beginning because there is a large amount available to diminish, then gradually levels off as the remaining quantity becomes very small. In radiometric dating, for example, isotopes decay at predictable exponential rates, and illustrations showing half-lives depict how each time interval reduces the amount by half—100%, 50%, 25%, 12.5%, and so on. The curve approaches zero but never quite reaches it, symbolizing how decay can continue indefinitely even when only traces remain. Exponential decay visualizations often include shaded areas that shrink progressively, helping viewers see how the decline slows rather than stopping abruptly.
A side-by-side exponential growth and decay illustration typically demonstrates the symmetry of compounding processes. Both curves begin at a baseline but move in opposite directions due to the sign of the growth rate. If the growth rate is positive, the graph accelerates upward; if the rate is negative, the graph bends downward toward zero. One of the most useful aspects of such an illustration is that it shows how dramatically growth and decay can diverge over time. At the outset, the curves may be close together and nearly linear, but as time passes they separate exponentially, emphasizing the long-term implications of compounding—something that often defies human intuition. This comparison helps explain why gradual growth in a population or investment can lead to sudden expansion, while gradual decay in radioactive material can leave detectable traces for thousands of years despite rapid initial decline.
Growth and decay illustrations also help visualize feedback mechanisms. In biological systems, positive feedback amplifies growth—like bacteria dividing uncontrollably in ideal conditions—while negative feedback slows systems and produces decay—like a drug being metabolized and eliminated from the bloodstream. Many scientific illustrations show feedback loops using arrows and cycles that reinforce or diminish the underlying quantity. These diagrams convey why exponential functions describe not just mathematical abstractions but real self-regulating or self-amplifying natural processes.
In computing and technology, exponential behavior is portrayed graphically when demonstrating patterns such as the increasing number of transistors on computer chips over time, rapid adoption of digital platforms, or viral spread on social media. These diagrams highlight the compounding effect of information sharing: when one person transmits data to many, and each recipient transmits further, exponential growth emerges. Exponential decay, conversely, appears in digital fields such as memory retention curves, where information becomes harder to recall over time, or battery discharge curves, where energy output declines exponentially as cells deplete.
Economic and financial illustrations of growth versus decay frequently use bar charts and compounding sequences to emphasize the power of reinvestment and the weight of depreciation. Compound interest graphs show savings accounts or investments rising sharply after long periods of steady contribution, revealing why early and consistent saving magnifies long-term returns. On the other hand, decay models explain depreciation of assets, diminishing returns, inflation reducing purchasing power, or loan balances shrinking due to repayment schedules. When these principles are depicted visually, the advantage of early growth and the risk of unchecked decay become obvious.
Environmental science diagrams also employ exponential models. Human populations, carbon emissions, algae blooms in nutrient-rich lakes, and pathogen outbreaks follow exponential growth patterns until they encounter limiting factors. Meanwhile, the exponential decay of pollutants in water, the breakdown of organic matter, and the dissipation of radiation contribute to ecosystem recovery. Visualizations comparing these systems emphasize that exponential functions are not always beneficial or harmful—they describe change itself, which can have positive or negative outcomes depending on context.
Growth and decay illustrations frequently extend beyond graph lines to include informational flow along timelines, showing not just quantity but pacing. Growth timelines steadily widen their spacing between events as more changes occur in shorter periods; decay timelines compress events early and spread later events farther apart. This timeline visualization helps explain why exponential growth often feels slow until it is suddenly fast, and why decay feels dramatic at first but becomes barely noticeable as the quantity nears zero.
Ultimately, an illustration of exponential growth and decay transforms symbolic mathematical patterns into a vivid understanding of how systems evolve through time. It makes visible the compounding power behind population increases, viral spread, financial investments, chemical reactions, radioactive disintegration, and countless biological and physical processes. By watching curves rise sharply or gently fall, the viewer gains clarity into how feedback, proportional change, and time determine the future of dynamic systems. Exponential growth demonstrates how small beginnings can lead to massive outcomes, and exponential decay demonstrates how large quantities can dwindle to near nothing. Together, these illustrations illuminate one of the most crucial mathematical truths in science: change accelerates when it compounds and decreases when its foundation erodes, shaping processes across every field from ecology to economics to the laws of physics themselves.