Zig Zag Indicator — A Detailed Guide to Market Swings, Structure, and Trend Clarity
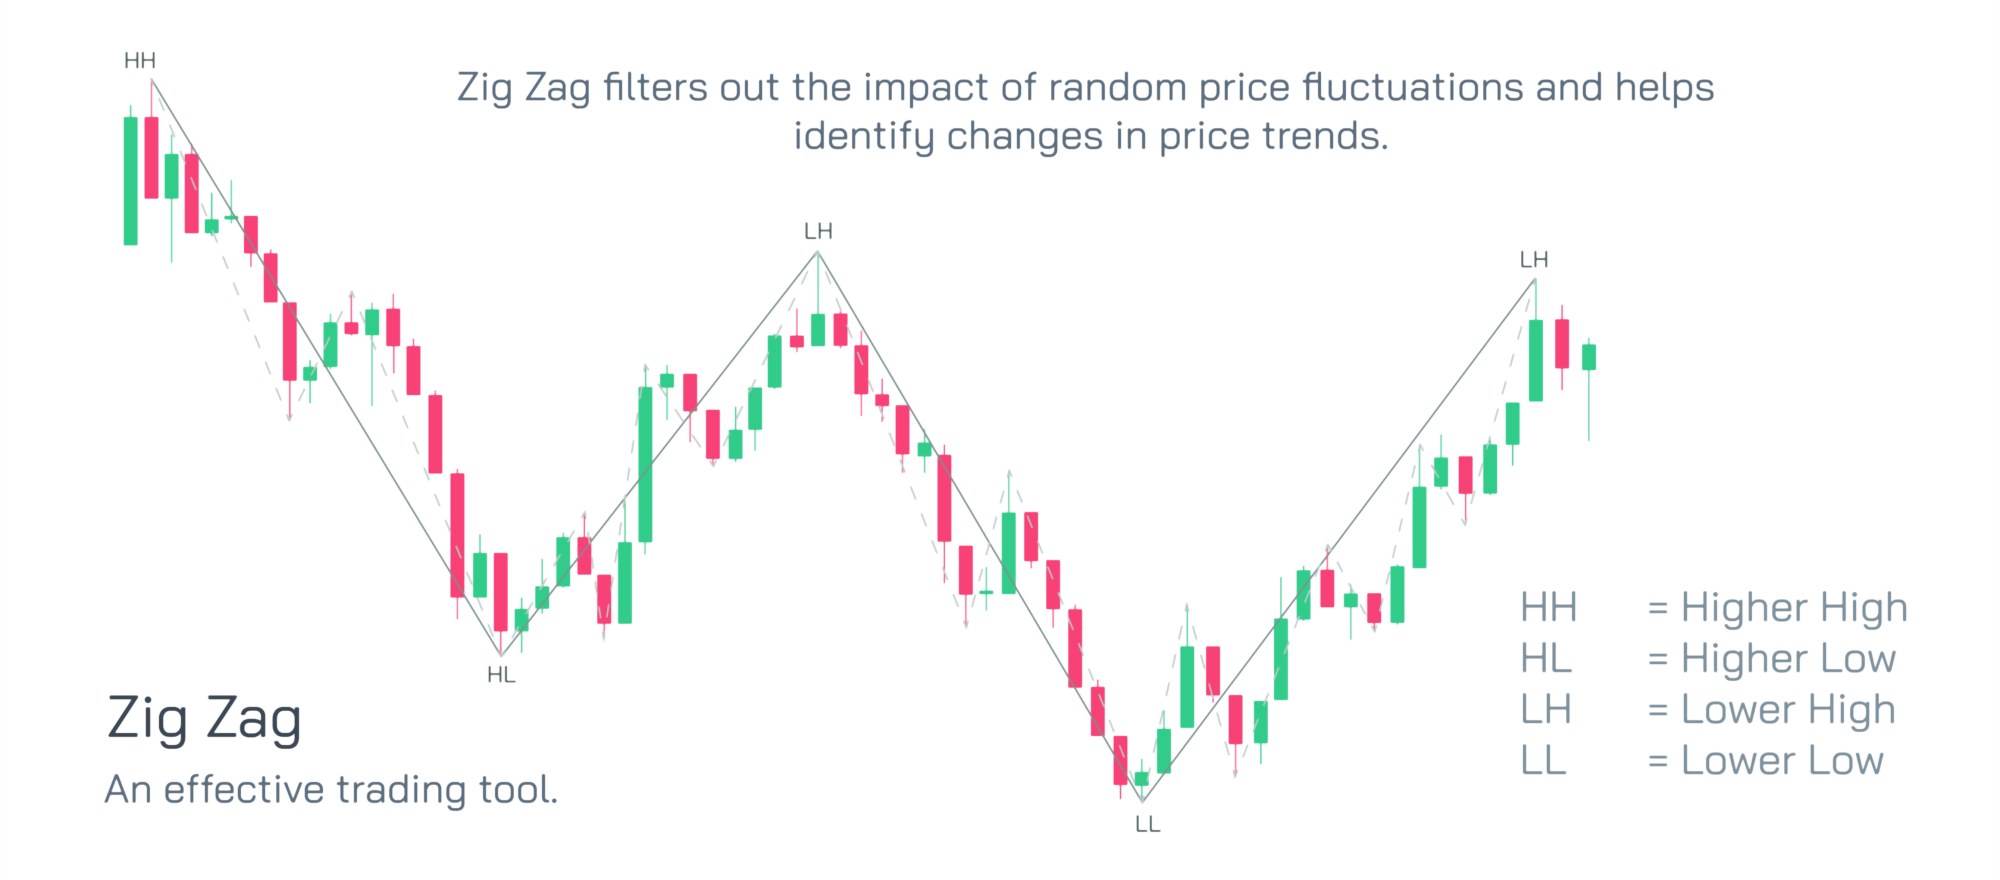
The Zig Zag indicator is one of the most effective tools for simplifying chart structure. Instead of focusing on every small vibration in price, it highlights major turning points and filters minor fluctuations that often create confusion. This makes the entire chart cleaner, easier to interpret, and more suitable for studying swing behavior. Because markets move in waves, this tool helps traders adopt a structured perspective of these waves without the clutter that normally appears in real-time movement.
The indicator works by plotting lines only when price reverses by a specific percentage or value. This filter eliminates many irregular moves that would otherwise distort the trader’s interpretation. When movement reverses beyond the chosen threshold, the tool draws a new leg. This approach allows traders to focus on the meaningful parts of market structure. The logic behind the tool aligns with the natural tendency of markets to move in alternating legs, forming a sequence of pushes and pullbacks. By revealing these sequences clearly, the tool supports deeper structural analysis.
One of the most important uses of the Zig Zag indicator is identifying swing highs and swing lows. These form the backbone of many trading decisions, from trend classification to breakout study. When these points appear clearly on the chart, a trader can assess whether the environment is forming higher highs, higher lows, lower highs, or lower lows. This clarity helps confirm the direction of the trend and assists in recognizing shifts in behavior. Without such filtering, the chart may appear too jagged, leading to poor decision-making.
The tool is also valuable for pattern study. Many classic formations such as waves, channels, and triangles become easier to observe once the chart is cleaned using Zig Zag. Because the tool removes unnecessary noise, the resulting structure makes these formations more apparent. This can help traders identify potential continuation or reversal patterns that may influence future movement. Wave identification, in particular, becomes much more accessible because the major legs stand out clearly from the surrounding action.
Another strong use of the indicator lies in trend behavior. When the sequence repeatedly forms upward legs that are longer than downward legs, the structure naturally points toward upward strength. In the opposite case, the structure may signal downward pressure. The indicator visually represents this balance of momentum. Instead of relying on emotional interpretation, the trader examines the relationship between successive legs. This objective viewpoint contributes to disciplined decision-making.
The tool also assists with measuring the magnitude of swings. Traders can compare the length of each leg to assess strength and weakening. A shrinking leg may signal fading energy, while an expanding leg may suggest acceleration. Because the tool organizes movement neatly, this size comparison becomes straightforward. A sequence of diminishing legs may indicate potential slowing before a larger rotation. Similarly, an expanding rhythm may highlight rising activity as the environment gains momentum.
Many advanced traders use Zig Zag for retracement and extension analysis. Because major points are marked cleanly, tools like Fibonacci retracements and projections align more precisely with swing behavior. This alignment helps traders target potential reaction zones. Without a clear series of swing points, such analysis becomes unreliable. The Zig Zag tool ensures that measurements are based on meaningful movement rather than random spikes.
Consolidation phases also become more visible through this tool. In a balanced environment, the indicator draws a tight sequence of shorter legs, showing clear contraction. These periods often signal preparation for a larger directional move. Recognizing contraction zones early allows traders to plan for potential breakout situations. This identification is far easier on a filtered chart because the structure becomes more readable and orderly.
Another useful benefit lies in managing psychological clarity. Chart noise often leads to stress, especially during fast markets. By compressing movement into essential structure, the indicator reduces confusion and supports calm, stable interpretation. Traders who rely heavily on rhythm and organized flow often use this tool to maintain a cleaner workspace. The simplified structure provides a visual form of discipline and encourages consistent planning based on objective legs rather than emotional reactions.
Because the Zig Zag indicator does not predict direction and instead responds to completed moves, it is best used as a structural tool rather than a signal generator. Traders often combine it with other tools such as moving averages, oscillators, or volume studies to confirm directional setups. This combination adds additional layers of context, improving decision-making. The indicator’s primary role is organization: it makes the chart readable so that other tools can be applied more effectively.
Swing traders, in particular, rely on this tool because it enhances the identification of major moves. Day traders also use it during slower sessions to reveal clean structure. Whether used for broad analysis or fine structural study, the Zig Zag indicator offers a dependable way to focus on meaningful action. It transforms raw movement into an organized pattern of alternating legs, bringing clarity to the natural flow of markets.