Understanding RSI Divergence for Trend Reversal, Momentum Weakness, and Reliable Trading Decisions
RSI divergence is one of the most respected concepts in technical analysis because it exposes the hidden imbalance between price movement and underlying momentum. While price can continue rising or falling due to emotional participation, liquidity pockets, or short-term volatility, the RSI oscillator measures internal strength. Divergence forms when price and RSI move in opposite directions, signaling that the prevailing trend is losing power. This creates a powerful early warning system for traders who want to anticipate reversals, avoid traps, and recognize when a trend is beginning to weaken beneath the surface.
The core idea behind RSI divergence is that momentum always shifts before price does. A market may push into a new high, but if RSI prints a lower high, it signals fading strength. Large participants might be reducing exposure, liquidity may be drying up, or the market may simply be overextended. Such conditions are not visible from price alone. Divergence fills this gap by revealing the internal slowdown. Traders who rely solely on price can be caught in a failure swing, but those watching RSI divergence gain valuable early insight into the evolving structure of the trend.
Bullish divergence occurs when price makes a lower low but RSI makes a higher low. This suggests that although sellers manage to push the price downward, their momentum is weakening. The strength of bearish pressure diminishes, indicating the possibility of accumulation or exhaustion in the downtrend. Bullish divergence often appears in oversold zones, where selling pressure is nearing completion. Traders interpret this as a potential reversal signal or a cue to prepare for a shift from a declining phase to a stabilizing or rising structure.
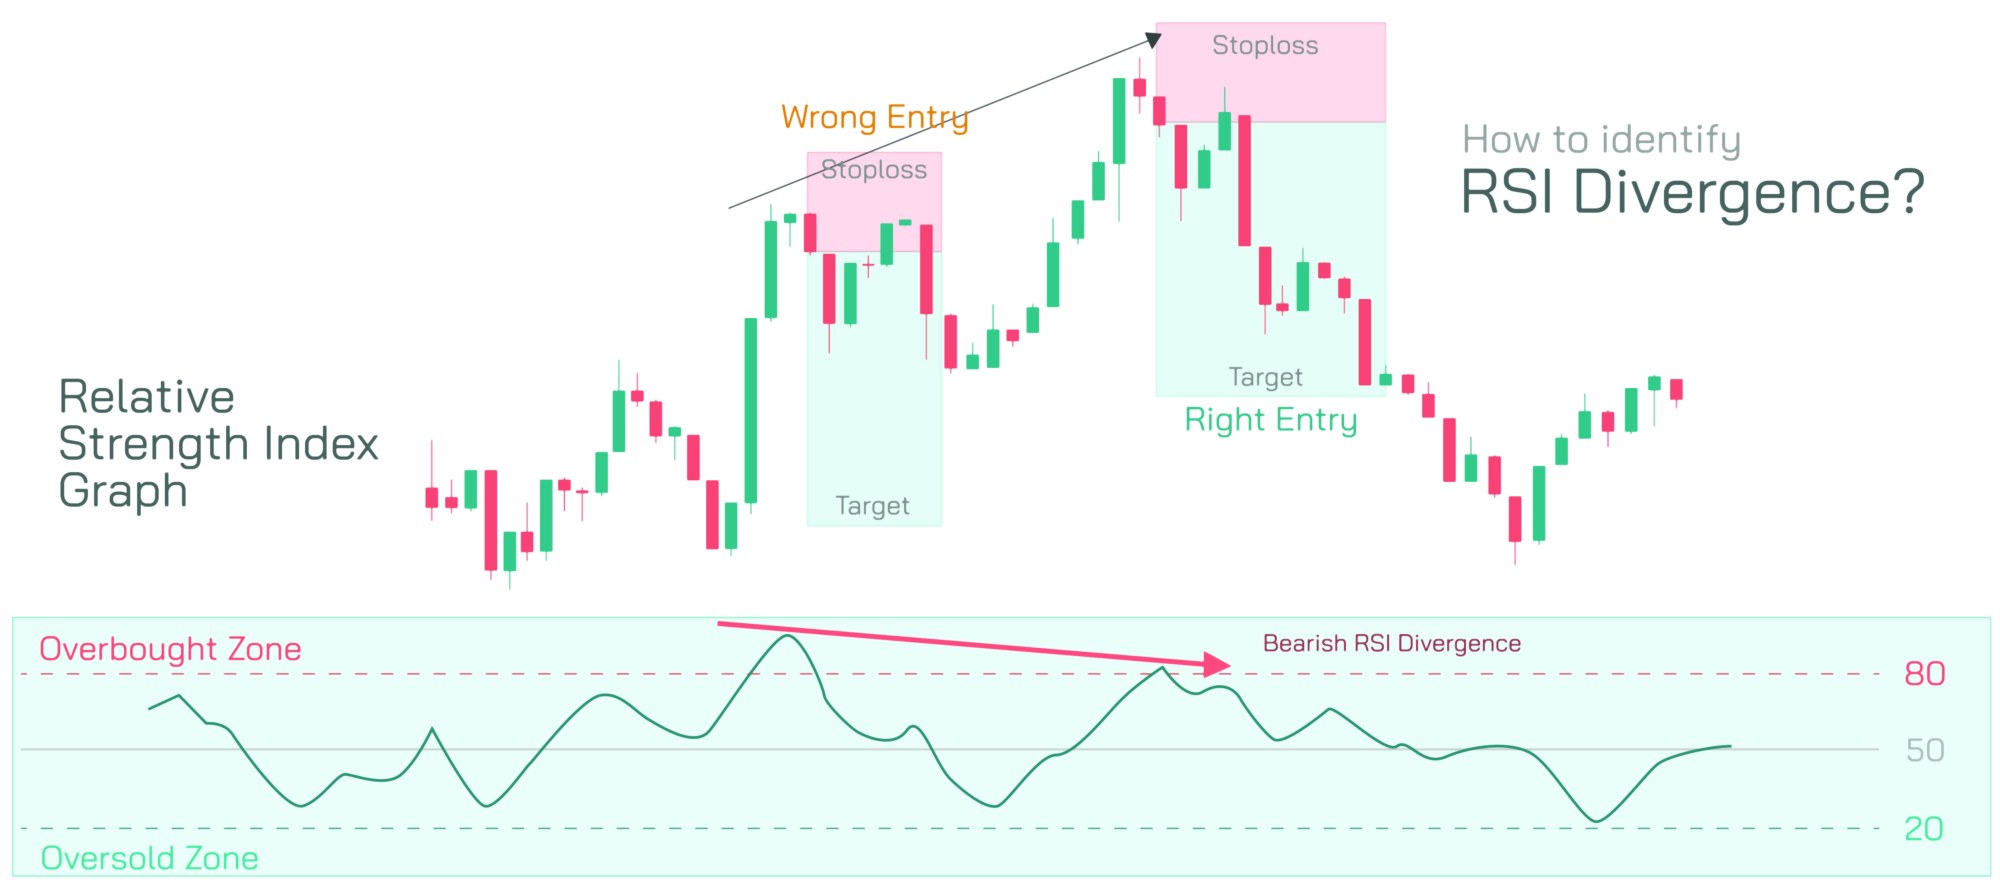
Bearish divergence, on the other hand, develops when price makes a higher high while RSI makes a lower high. Although the chart shows strength on the surface, the actual momentum behind the movement is fading. This pattern commonly appears in overbought regions, signaling that buyers are losing control. The divergence reveals distribution or a slowdown in bullish dominance. Bearish divergence is one of the strongest alerts that a trend may be approaching exhaustion, and traders use it to avoid late entries into an extended move.
Hidden divergence adds depth to analysis by providing continuation confirmation rather than reversal. Hidden bullish divergence forms when price makes a higher low but RSI prints a lower low. This means the trend remains strong even if the oscillator temporarily weakens. Hidden bearish divergence shows price making a lower high while RSI creates a higher high, confirming continuation of the downtrend. These patterns are essential for traders who want to distinguish between genuine reversals and simple pullbacks within a larger trend.
Understanding RSI divergence requires reading swing points correctly. The relationship between pivot highs and lows is what forms divergence—not incidental fluctuations. When price structure forms clear swings, RSI comparison becomes meaningful. Traders must match the correct swing highs to swing highs and swing lows to swing lows to interpret divergence accurately. Misreading pivot points leads to false conclusions. The clarity of structure determines the accuracy of divergence signals.
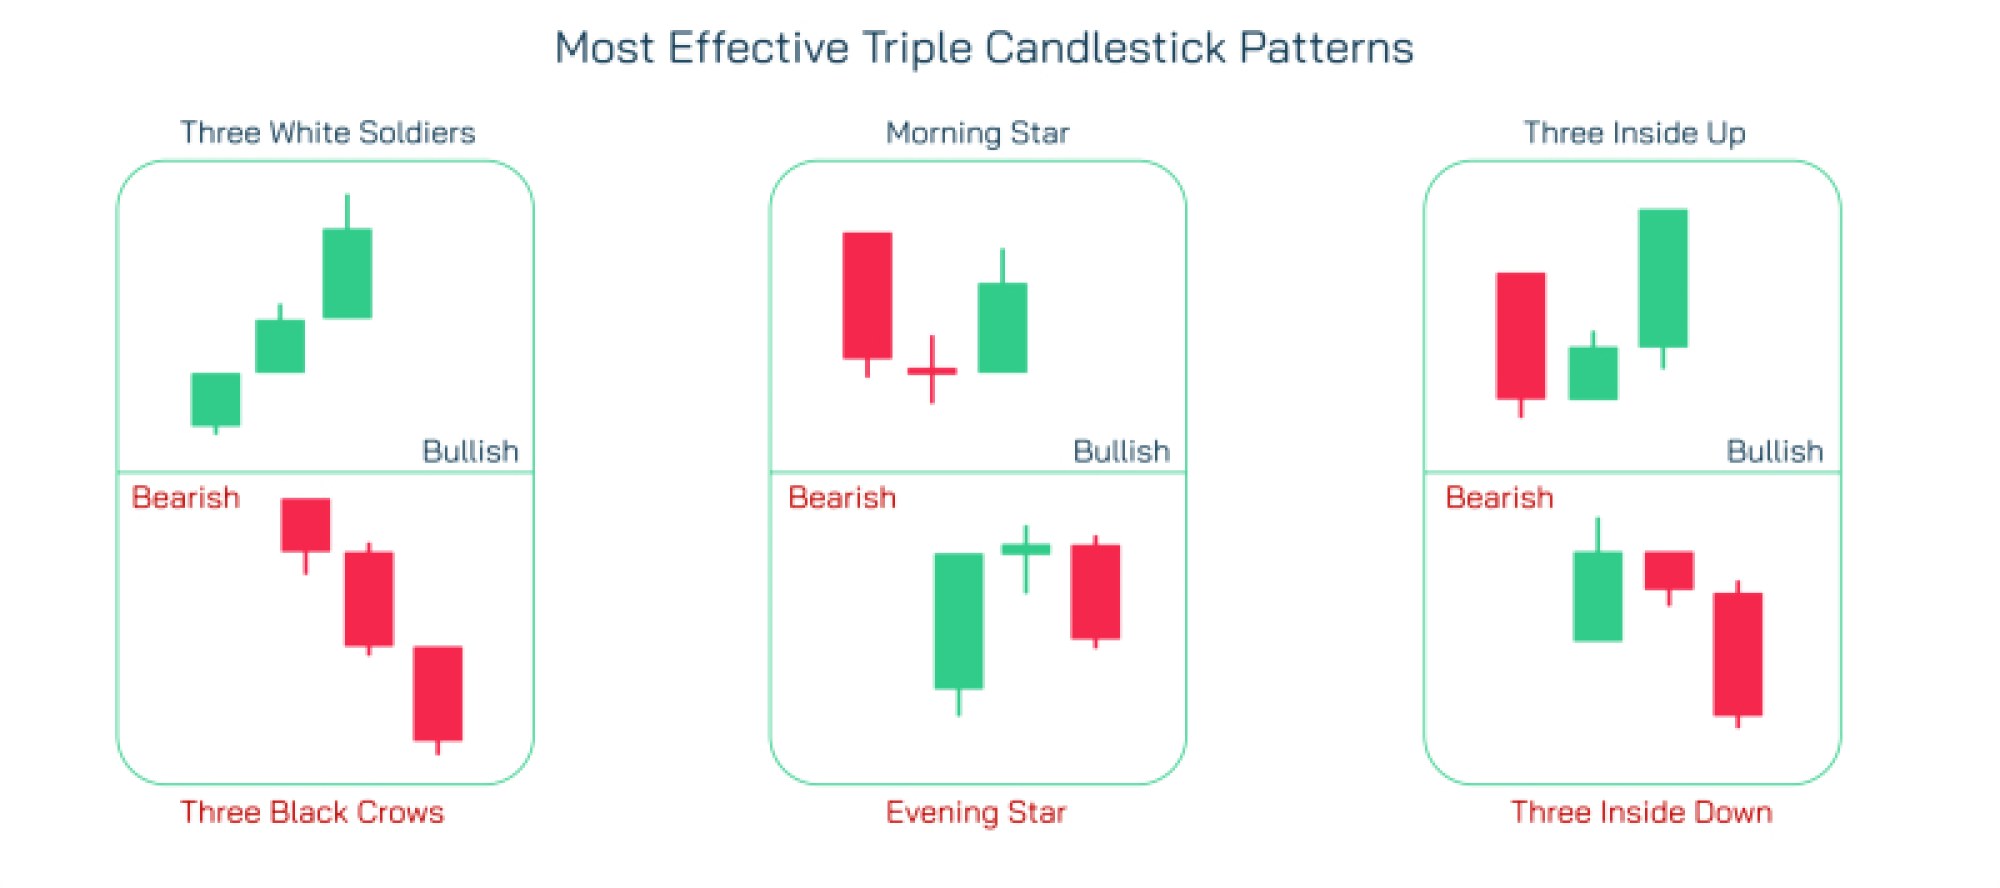
Volume and open interest can further strengthen divergence interpretation. When bearish divergence appears along with falling volume on new highs, the signs of exhaustion become stronger. Similarly, bullish divergence paired with reduced selling intensity provides a higher probability of reversal. Divergence is most effective when supported by additional confluence factors such as trendlines, support and resistance, moving averages, or candlestick patterns.
In practical trading, RSI divergence helps in timing entries, avoiding poor trades, and identifying shifts long before they become visible. When divergence forms near major support or resistance levels, it becomes especially meaningful. For example, bullish divergence forming at a historical support level aligns internal strength with structural support, increasing the likelihood of a reversal. Likewise, bearish divergence forming at a resistance zone combines weakening momentum with structural rejection.
RSI divergence is not a standalone buy-sell tool. It is a diagnostic indicator that reveals internal weakness or strength. The purpose is not to blindly reverse trades but to understand whether the trend still carries conviction. The deeper insight it provides into market behavior helps traders make decisions aligned with momentum, structure, and risk management. Ultimately, RSI divergence becomes a window into market psychology—capturing when confidence grows, when weakness begins, and when transitions are unfolding beneath the price chart.