Understanding Support and Resistance in Stock Market Trend Behavior and Trading Strategy
Support and resistance are the foundation of market structure, and every price chart is shaped by these levels. They represent regions where buying or selling pressure repeatedly influences price. Support is the zone where demand strengthens enough to halt a decline, while resistance is the zone where supply becomes strong enough to pause or reverse an advance. These levels form the psychological and structural backbone of every market cycle. Traders across all styles—intraday, swing, or positional—use them to understand trend behavior, anticipate movement, and manage risk with greater precision.
Support levels emerge when buyers consider price attractive and step in to absorb selling pressure. A chart touching support and bouncing upward reflects renewed confidence from participants who believe value is present. This makes support an important area for potential entries, especially when the market shows signs of strength. Resistance develops when price climbs to a point where sellers find it attractive to unload positions. When a chart repeatedly rejects higher levels, it signals that supply dominates demand. Resistance becomes a zone where traders take caution with long positions or consider potential short entries.
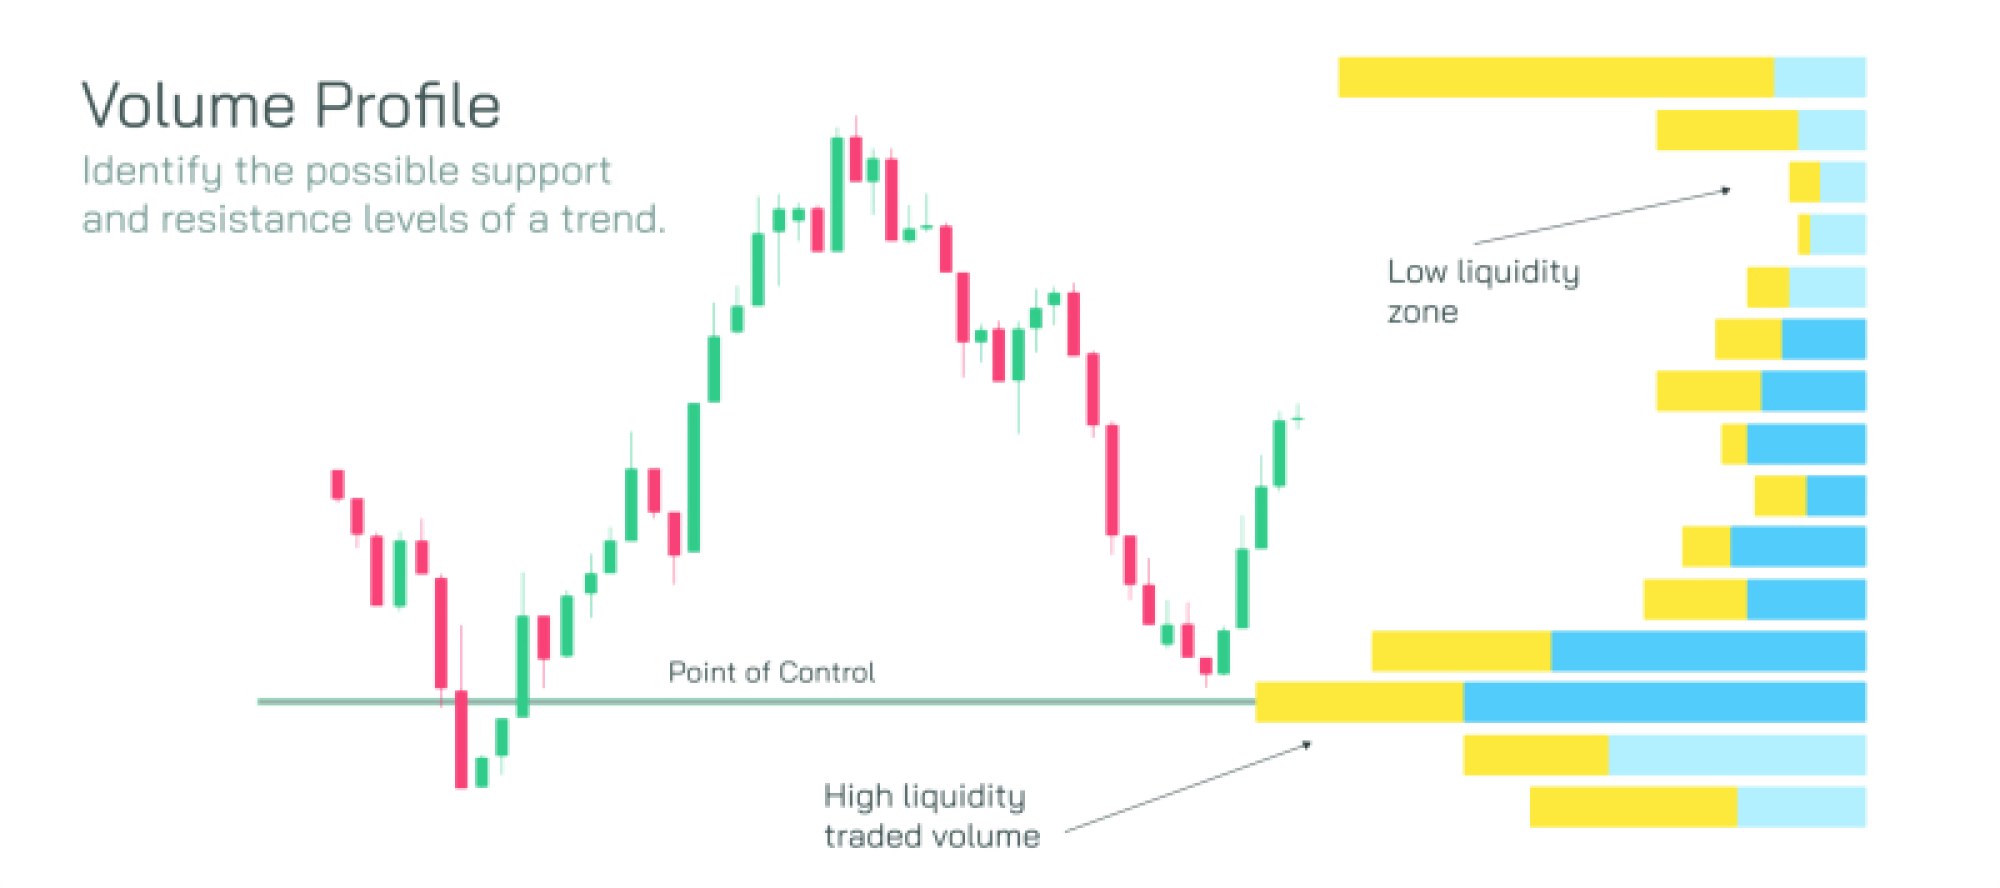
These levels become more meaningful when they are tested multiple times. A support level touched several times reflects stability in buying interest, while a resistance level revisited frequently represents persistent selling pressure. The more a level reacts, the more traders trust it, creating a self-reinforcing effect driven by market psychology. When price approaches one of these areas, traders anticipate reactions. This expectation itself strengthens the level, as many decisions cluster around the same zone.
Breakouts occur when price finally pushes through a strong level with conviction. A support breakout signals that sellers have overwhelmed buyers, driving the market into a new lower region. A resistance breakout indicates that buyers have overpowered sellers, allowing the market to climb into new territory. Breakouts with strong volume or momentum confirm genuine strength, while weak breakouts may represent traps where price returns to the previous range. Traders rely on these clues to judge whether they should commit to the new trend.
Another important behavior is the role reversal effect. Once broken, support can turn into resistance, and resistance can turn into support. This happens because market participants who missed the original move often wait for price to retest the level before entering in the direction they expect. The retest creates fresh reactions, making the level active again even though its purpose has reversed. This dynamic interaction reveals how memory works in price structure and why markets revisit previous turning points.
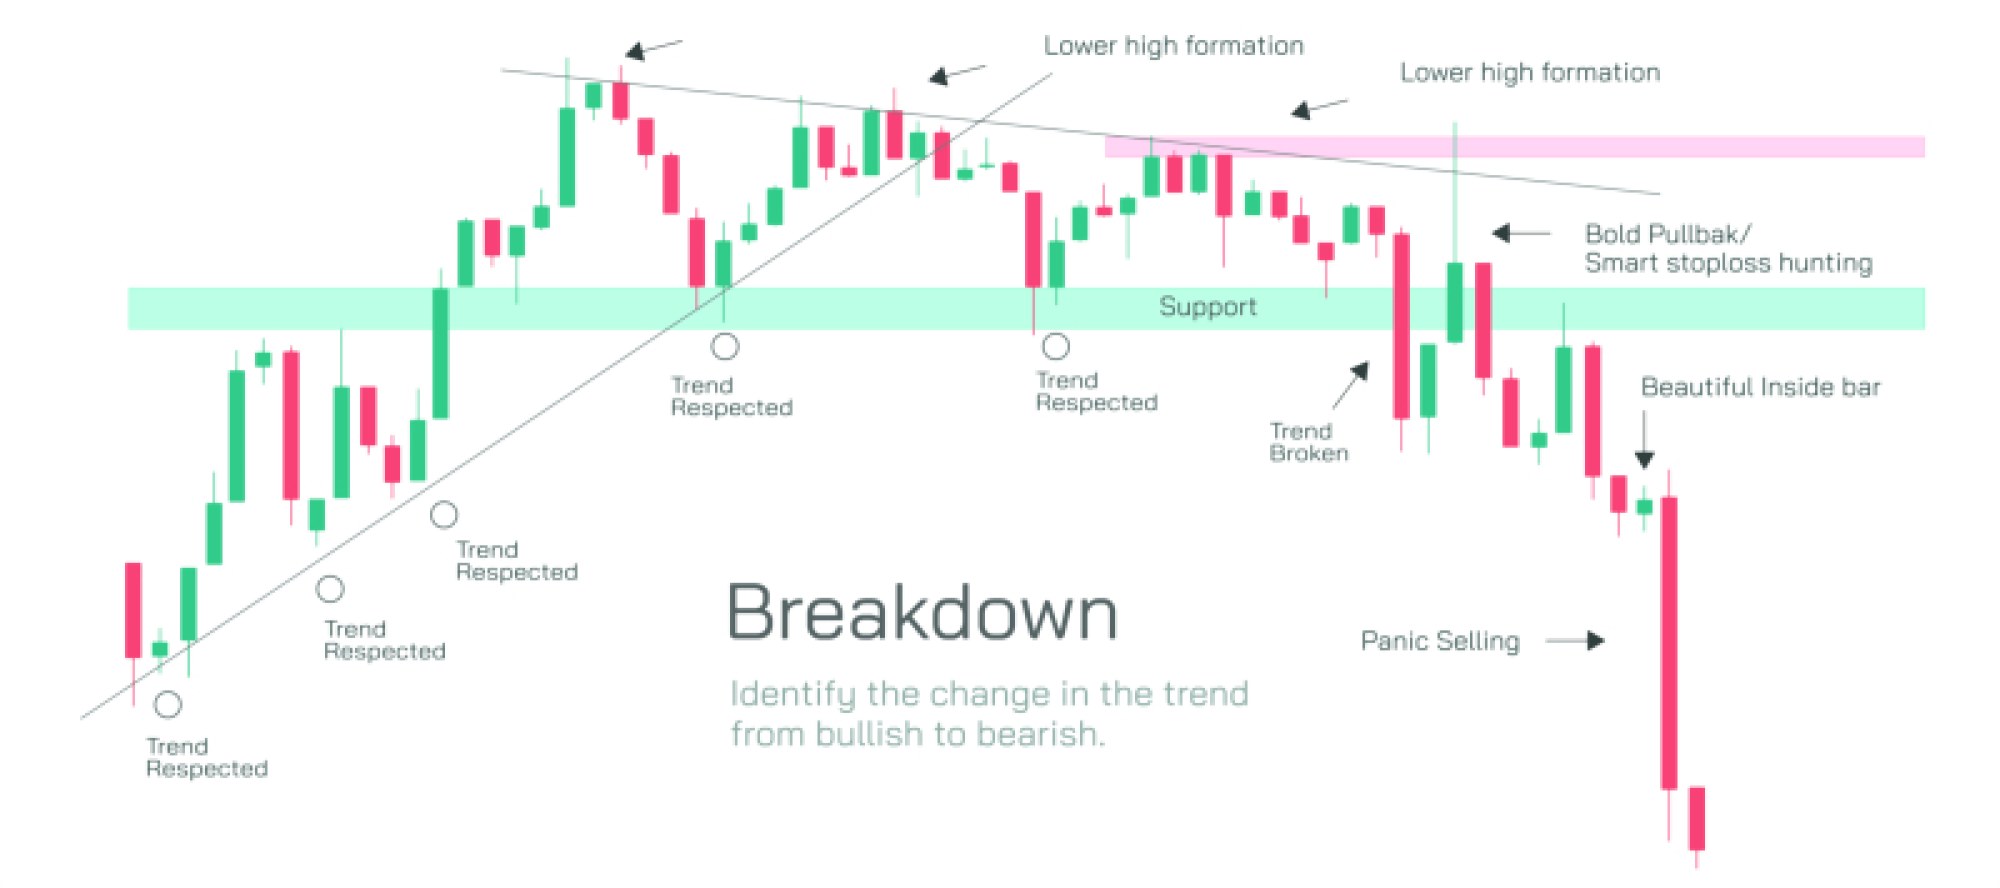
Support and resistance also help identify trend strength. In an uptrend, support levels rise as buyers consistently step in at higher points, showing increasing confidence. Resistance levels eventually break as bullish pressure increases. In a downtrend, resistance gradually moves lower as sellers dominate, while support continually fails. Watching how price behaves around these levels provides insight into whether a trend is weakening, gaining momentum, or preparing to reverse.
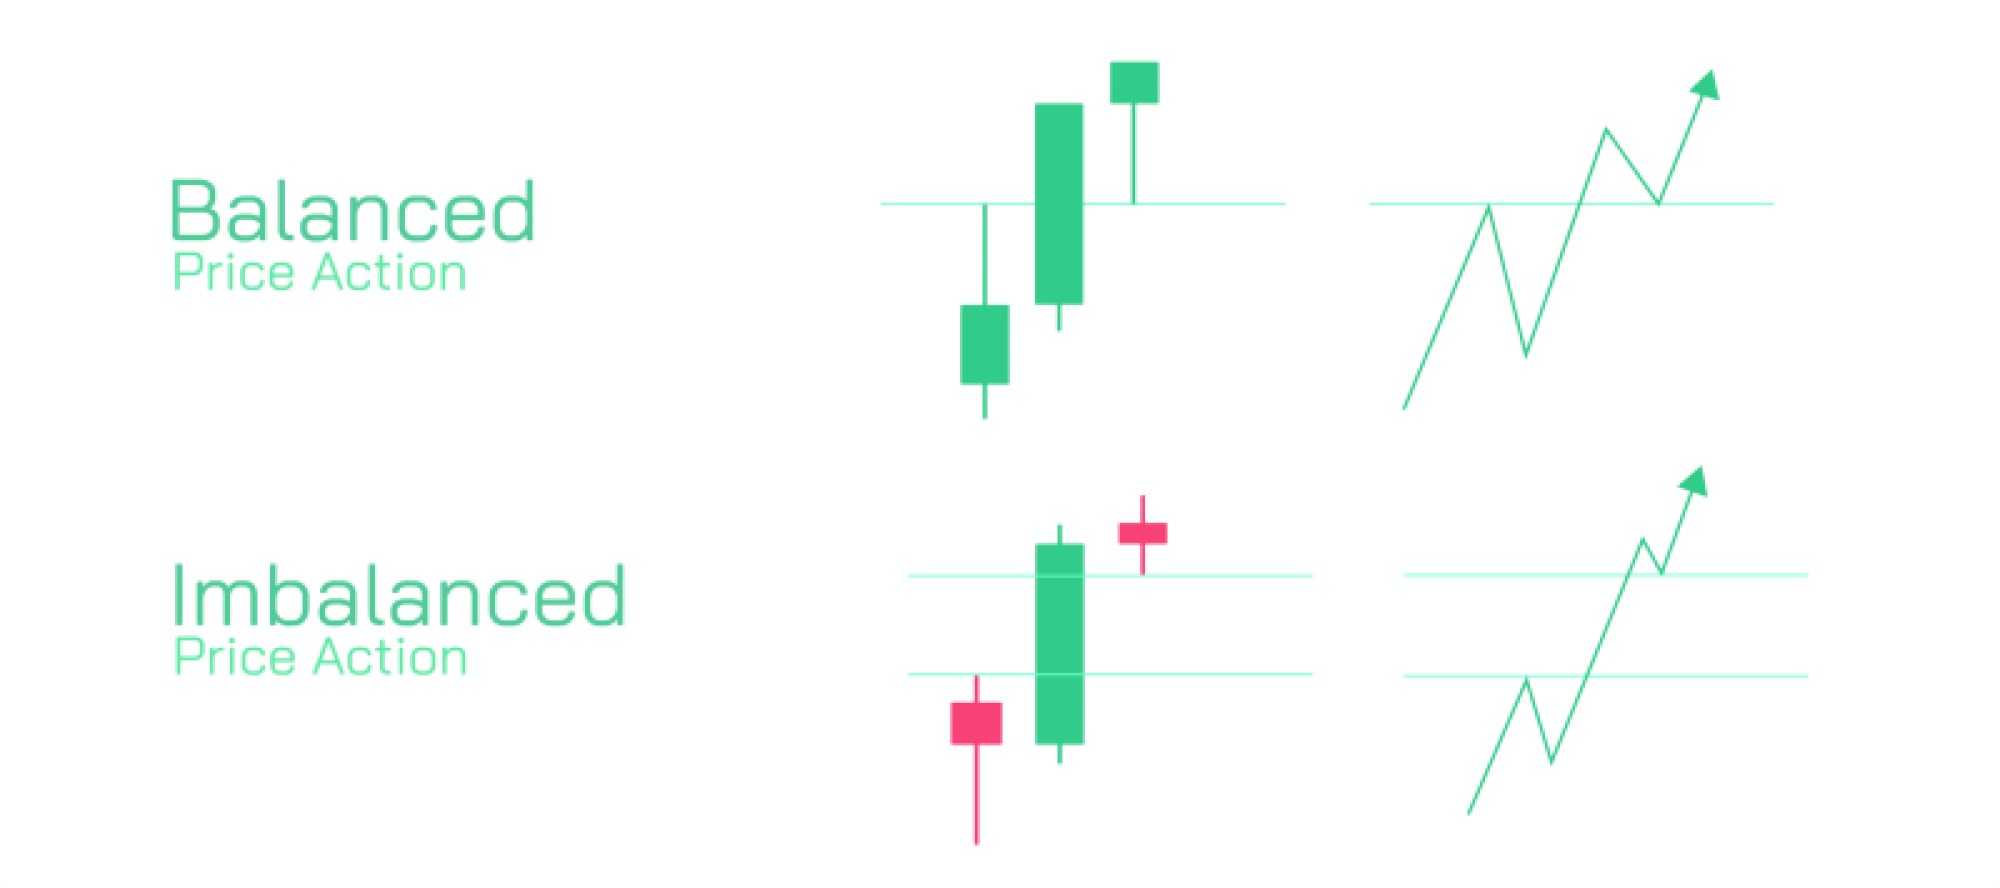
The distance between support and resistance defines the range of the market. When the distance is narrow, the market remains compressed, reflecting indecision. Wide distance shows expansion and increased volatility. Range-bound markets often oscillate between support and resistance until an imbalance triggers a breakout. Traders use this rhythm to trade within the range or prepare for directional shifts.
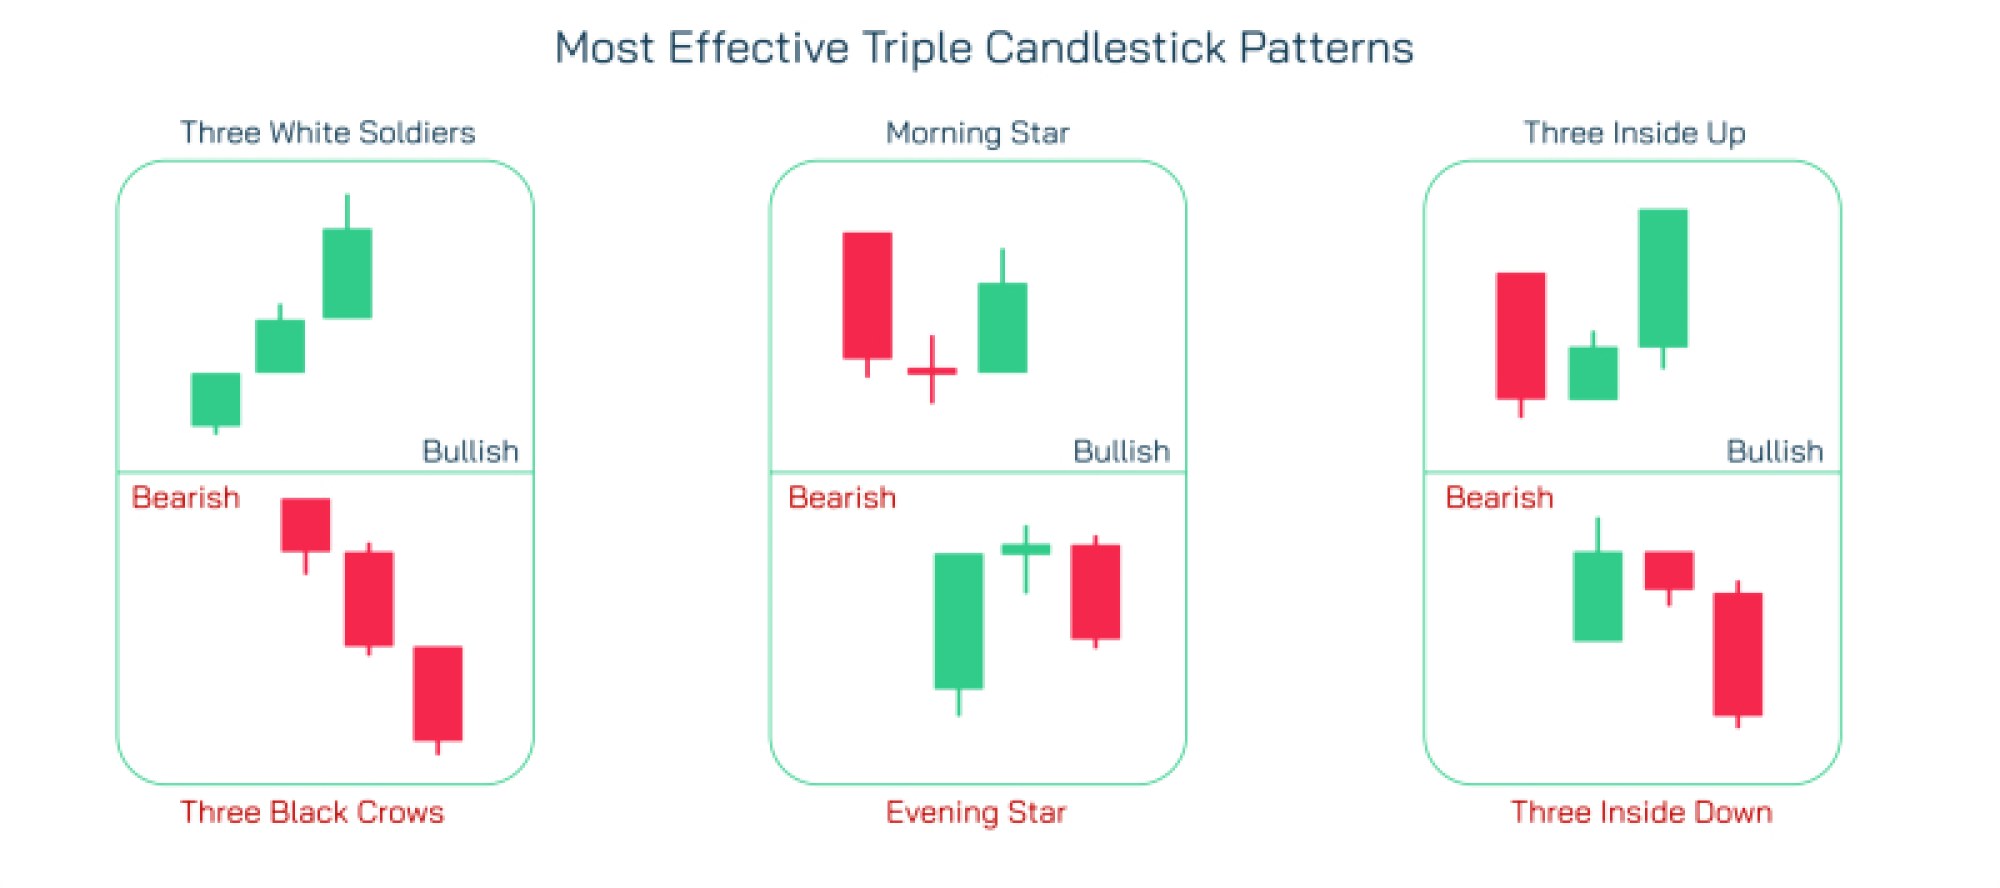
Candlestick behavior near these levels adds even deeper clarity. Rejection wicks, engulfing bodies, or momentum candles all help confirm whether a level will hold or break. The combination of structure and candle behavior transforms support and resistance from static lines into dynamic decision zones.
By understanding how support and resistance shape price flow, traders gain the ability to read market intentions more clearly. These levels connect psychology, structure, and momentum into a unified model. Whether used for timing entries, setting stops, or recognizing trend transitions, support and resistance remain the most powerful tools in technical analysis—simple yet deeply influential in every stage of market movement.