Understanding Important Fibonacci Levels and Their Role in Chart Pattern Behaviour
Fibonacci levels play an important role in interpreting market behavior, especially when traders study chart patterns, price swings, and structural reactions. These levels arise from ratios derived from the Fibonacci sequence, which appear naturally in various growth patterns. When applied to market swings, these ratios create reference points that help identify potential reaction zones. The levels do not predict future movement by force; instead, they mark areas where the market often shows sensitivity. Observing how price behaves around these points helps reveal rhythm, structure, and the internal balance behind ongoing movement.
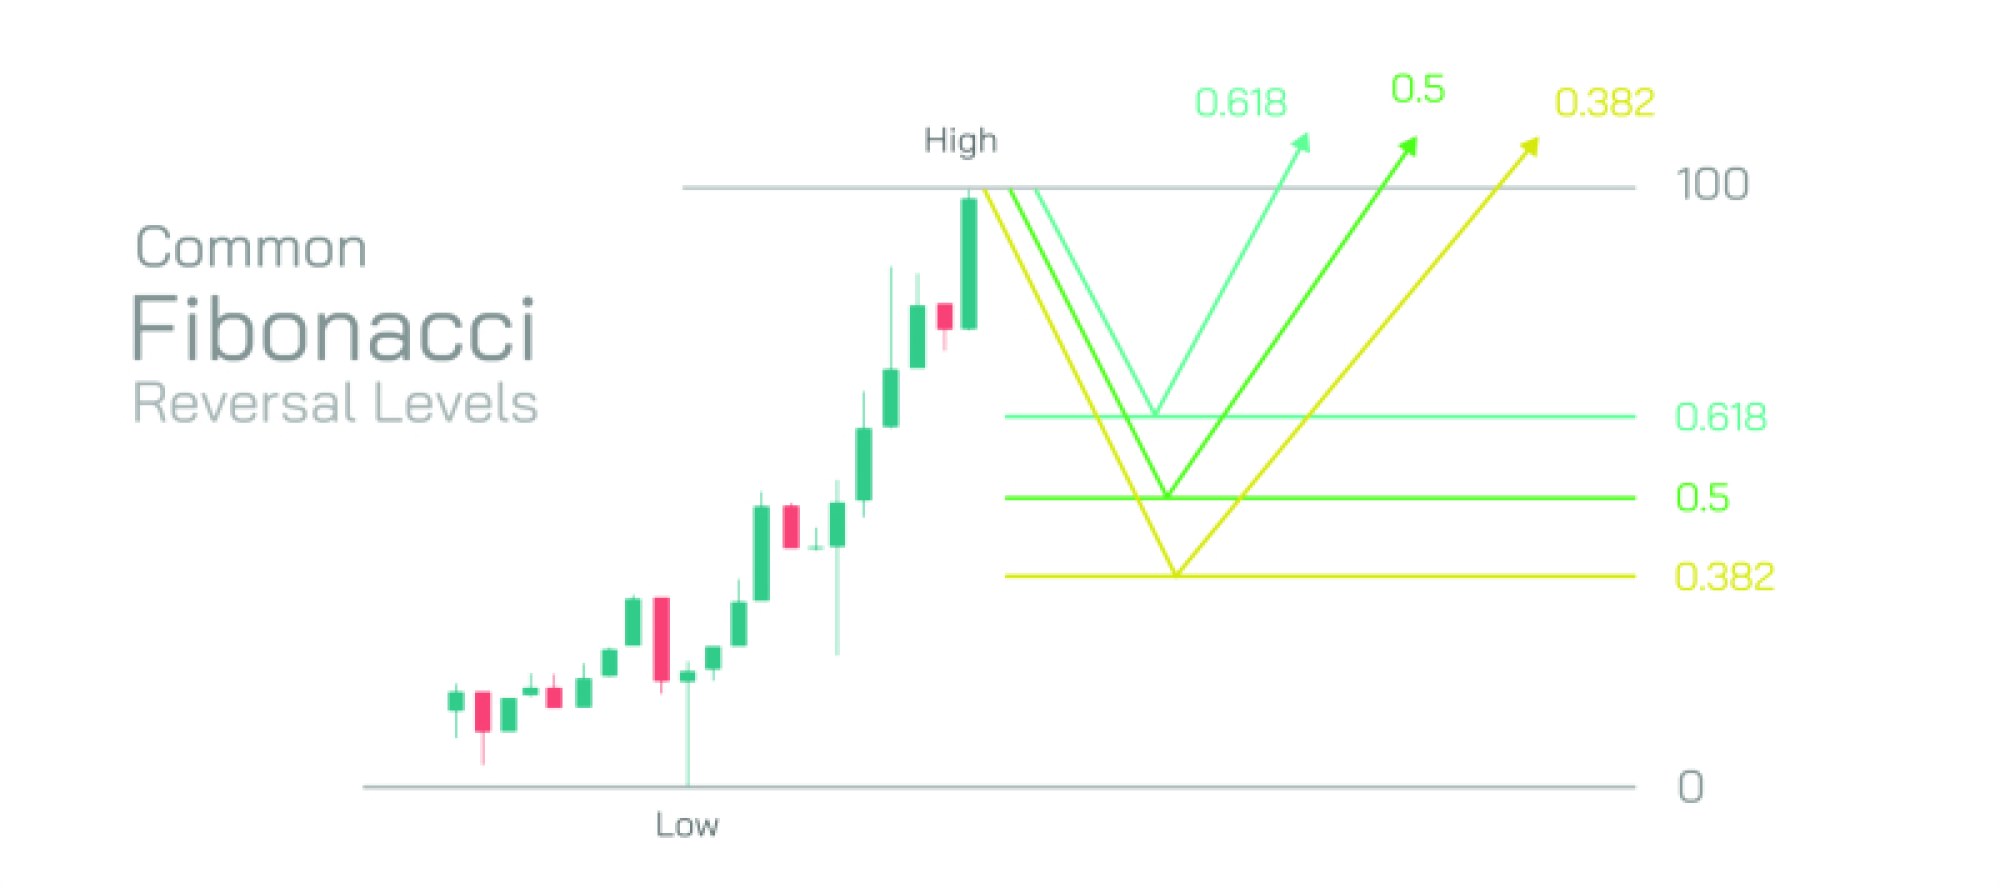
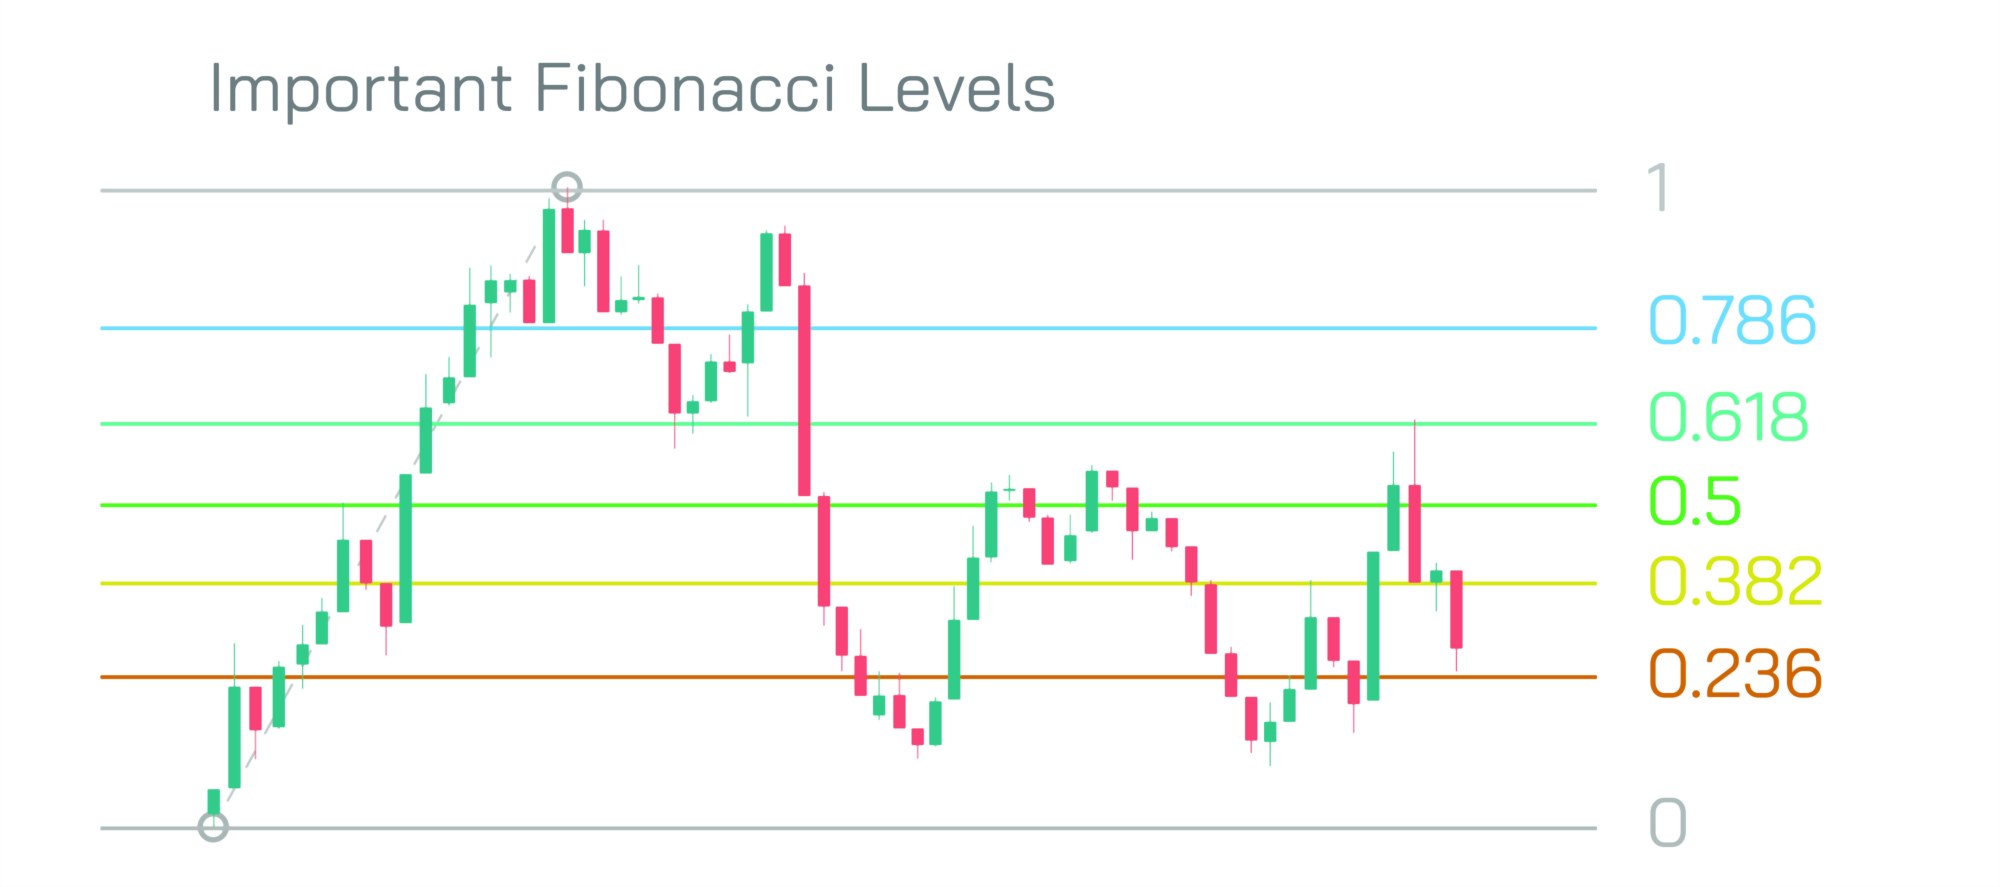
The most widely used levels are the retracement points. These include 23.6 percent, 38.2 percent, 50 percent, 61.8 percent, and 78.6 percent. Each level offers a different type of reaction zone. When price moves upward and begins to pull back, these levels act as checkpoints. They help answer a critical question: Is the pullback a normal correction within the trend, or is the trend losing its structure? The way price interacts with each level helps reveal this distinction. Shallow retracements often show strong underlying direction. Deeper retracements suggest weakening drive, creating a space where pattern development becomes more important.
The 38.2 percent and 61.8 percent levels attract particular attention. The first often appears during strong continuation phases, where corrections remain controlled. When price bounces near this region with aligned movement, the environment usually favors continuation. The 61.8 percent level marks deeper correction, where the trend still holds potential to resume but requires renewed strength. Many chart patterns—such as flags, wedges, and corrective waves—frequently develop near this region. Observing wave structure as it approaches these levels provides insight into whether the pattern reflects healthy correction or structural shift.
Extension levels add another dimension to Fibonacci analysis. These levels—such as 127 percent, 161.8 percent, and 261.8 percent—highlight potential zones for trend expansion. When price breaks from a pattern with energy, these extension points help estimate where the next reaction may occur. They serve as guides during directional moves, providing structure to phases that otherwise appear open-ended. The alignment between pattern completion and extension targets helps confirm whether the breakout has strength or whether the move may face pressure near predictable regions.
Fibonacci levels also interact deeply with chart patterns. When a pattern forms, the internal waves often respect one or more retracement values. For example, a pullback forming a rising pattern may pause around the 50 percent level before completing its shape. Likewise, a consolidation forming near a 61.8 percent zone may show a shift in internal pressure. Observing these interactions allows analysts to understand the developing narrative behind price. Each pattern gains clarity when viewed in combination with retracement reactions.
In addition, Fibonacci levels contribute to identifying potential turning points. When price approaches a major swing level from above, the reaction near a key ratio may reveal whether buyers still hold influence. If the level holds with clear wave alignment, the trend remains intact. If the level breaks with strength, the pattern shifts into a new phase. Thus, the levels serve as points for evaluating ongoing behavior, offering structure to both corrections and expansions.
The repeated appearance of these levels across various chart patterns stems from natural crowd behavior. Market participants often react near familiar zones because these zones align with logical proportions of prior movement. Whether consciously or unconsciously, the actions create repeated rhythm. This rhythm forms the foundation upon which Fibonacci analysis operates. By observing the structural reaction at these points, analysts gain access to deeper understanding of market flow.
Fibonacci analysis remains a widely used approach because it organizes market waves into clear reference zones. It enhances the reading of chart patterns, helps anticipate potential reaction areas, and clarifies the relationship between corrections and trend continuation. By understanding the structure behind these levels, traders gain insight into the unfolding behavior of price, allowing better interpretation of market movement.