VWAP and Volume Profile — A Deep Guide to Market Structure, Value Zones, and Trade Entries
Understanding the behavior of buyers and sellers across any trading session becomes clearer when two powerful tools are combined: VWAP and volume profile. Both highlight how markets organize themselves around value, flow, and balance. When used together, these tools offer an advanced view of where interest builds, where movement may begin, and where momentum can fade. This allows any trader to build a structured method instead of relying on random entries or emotional reactions. The nature of both tools is rooted in how participants place orders at different stages of the session, and how activity gathers in certain price clusters. This synergy forms the backbone of a complete approach to viewing market development.
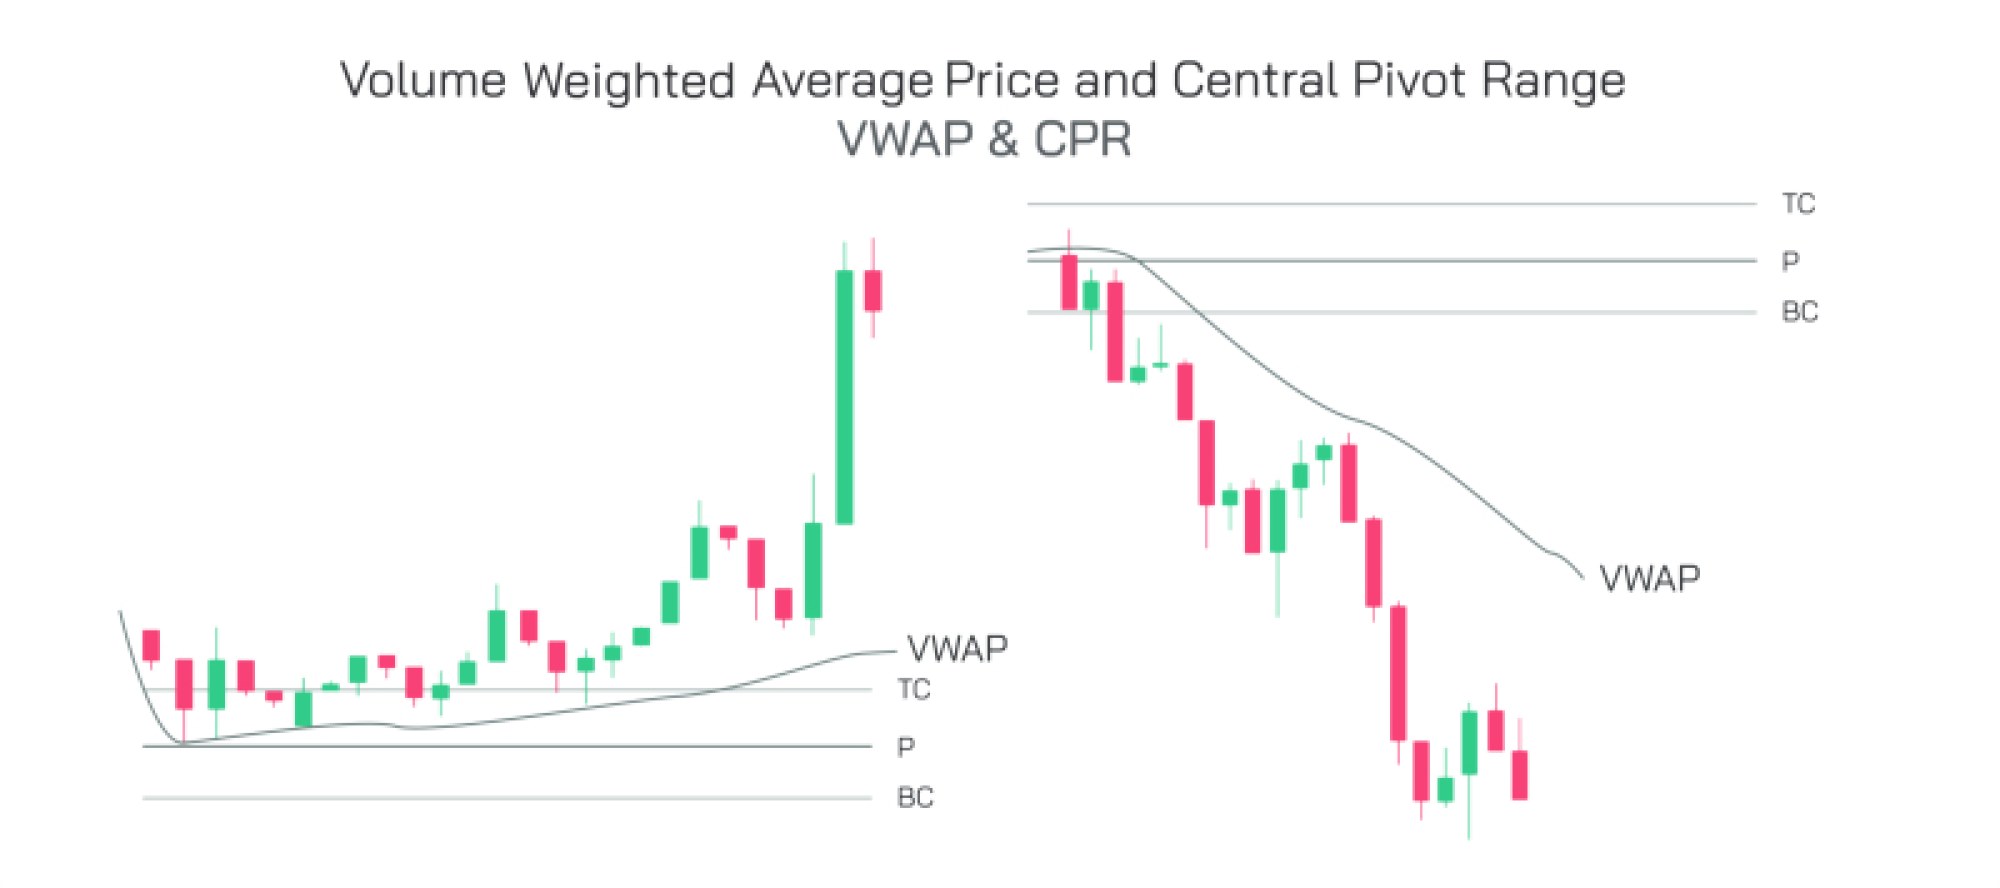
VWAP, which stands for volume-weighted average price, represents the average level where the bulk of traded contracts occurred during a session. This gives a clear center point that active players watch closely. Many large participants use this figure as a benchmark for evaluating fills or measuring whether the market is moving toward or away from a fair zone. When price stays above the line for most of the day, traders often consider the environment to be in a state where buyers are stronger. When it sits below, the influence of sellers feels more dominant. Because it updates throughout the session, it carries fluid information about the balance between buying and selling impulses.
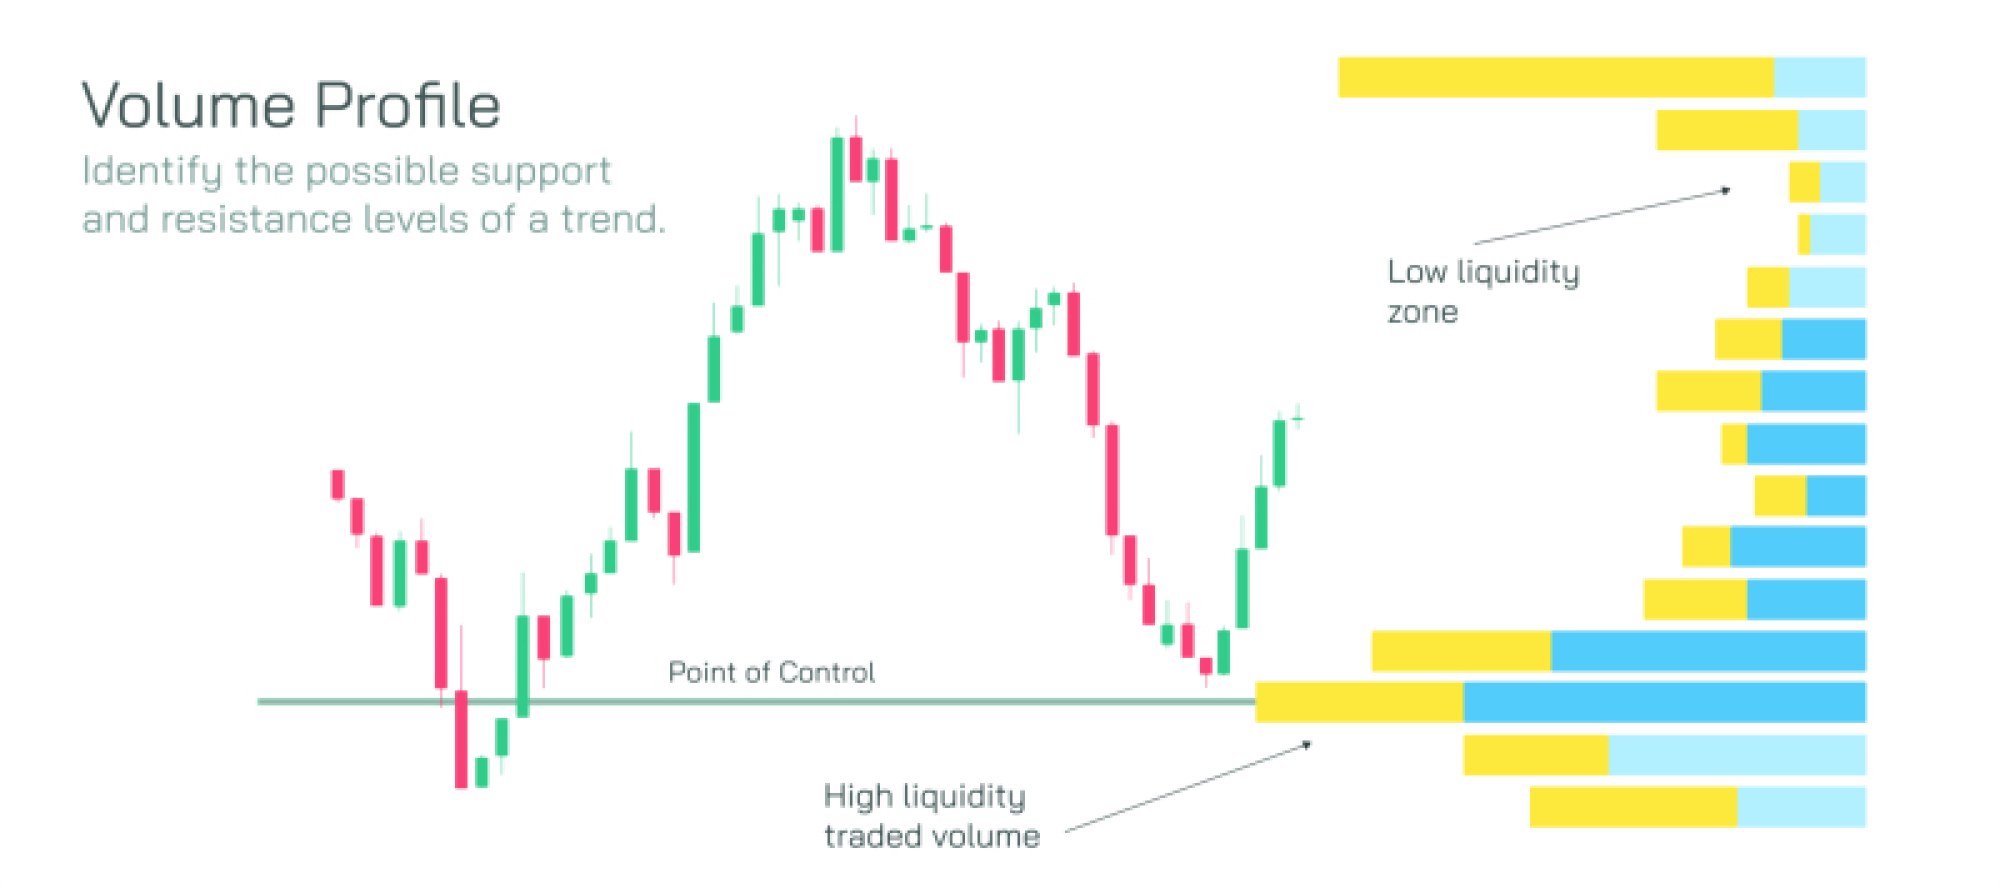
Volume profile adds another dimension to this view. Instead of averaging values, the profile distributes entire volumes across all price levels. This creates visible peaks called high-volume nodes, showing zones where active interest concentrated earlier. These peaks reveal places where both directions competed intensely, often forming a balanced environment. Between these peaks sit low-volume areas, regions that the market tends to move through faster because little interest formed there in the past. These contrast points build the foundation for understanding how price may react in the future when returning to these zones.
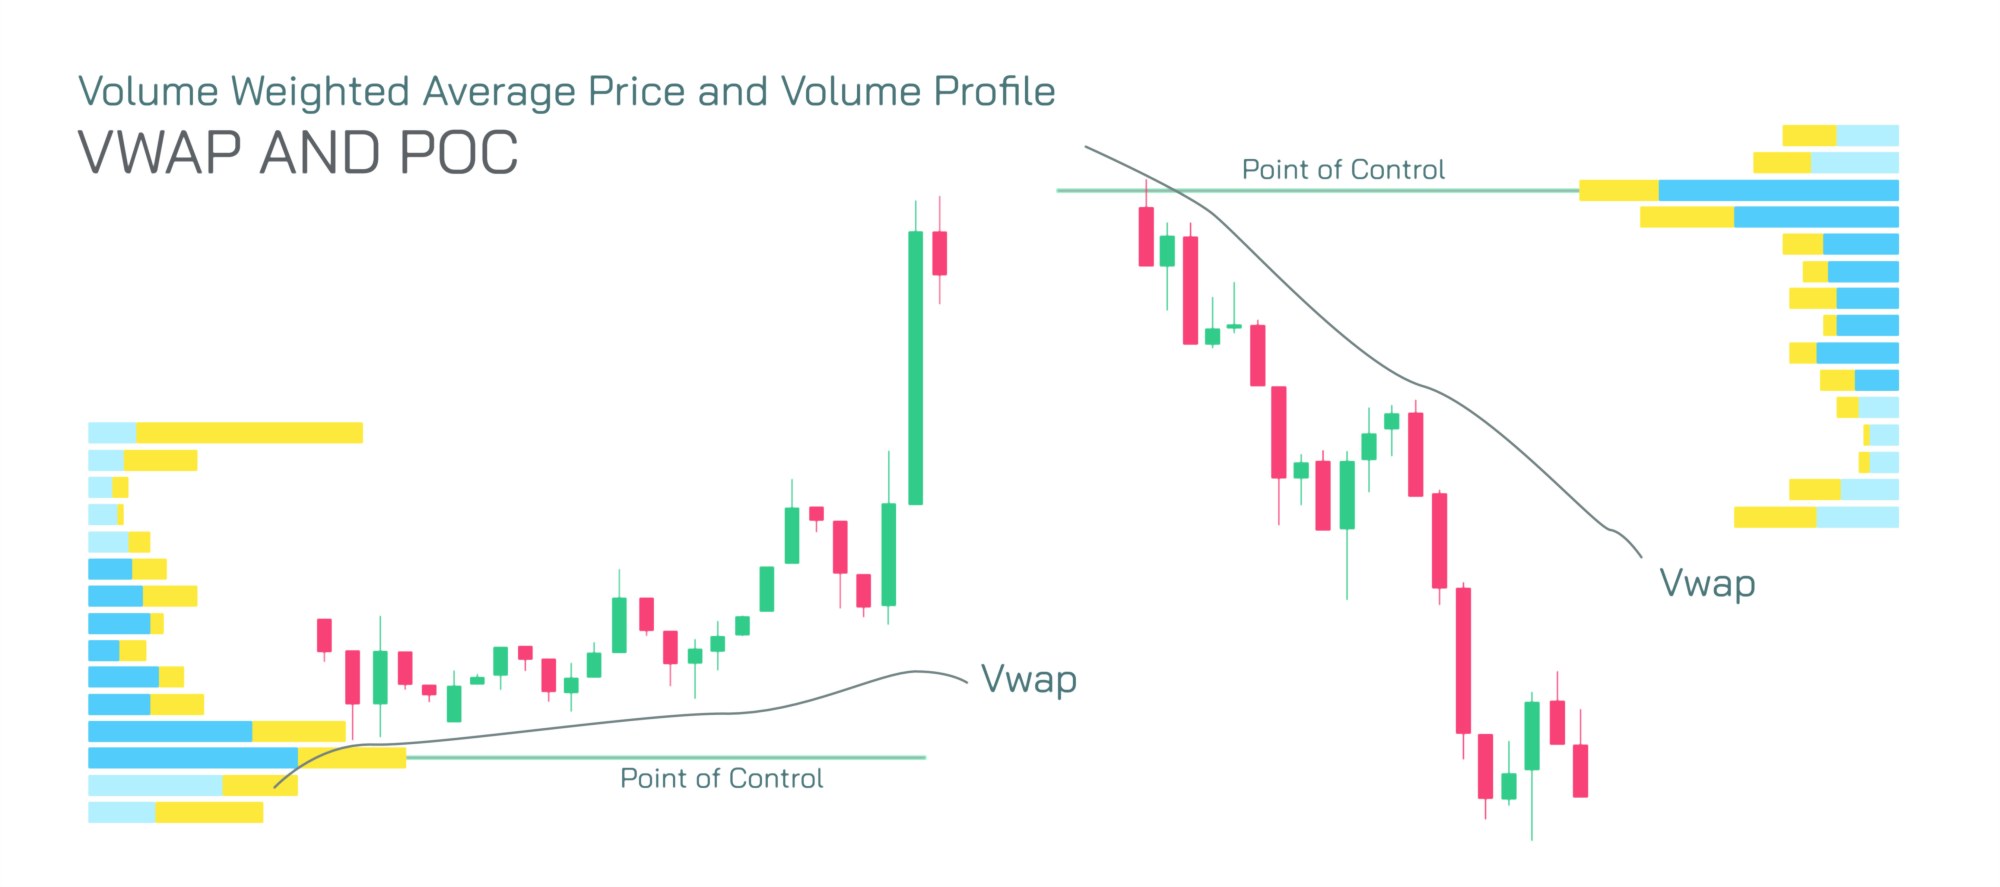
When both tools are layered on a chart, a stronger perspective emerges. VWAP reflects immediate session control, while volume profile highlights broader structural zones based on prior activity. A price moving toward VWAP after beginning far away may signal a return to balanced conditions. If it approaches during a period of low volume, the move becomes more decisive. When a strong node aligns near VWAP, the zone strengthens further. Many traders view these overlaps as reliable areas for planning entries or defense levels. For example, when price pulls back toward a node just above the VWAP after a steady rise, the region often acts as a stable support for continuation.
Another crucial aspect of volume profile lies in the value area. This area typically includes the majority of traded activity and helps define where the market considered fair action. When price remains inside this area, it often signals a quiet phase. A move away from this space can hint at the formation of imbalance. When VWAP also shifts in the same direction, the alignment may show stronger directional sentiment. These pieces together create a narrative of how the session may unfold. By understanding this narrative, the trader gains clarity on patience, timing, and suitable zones for action.
Trend identification becomes easier as well. A rising VWAP accompanied by most activity building above it offers clear bullish behavior. A falling VWAP with clusters stacked below typically confirms bearish conditions. When profile peaks begin shifting upward or downward along with VWAP, it reinforces the trend structure. During consolidation periods, the profile often forms a wide balanced range, and VWAP stays centered within this area. Many traders prefer to wait for breaks from this formation before taking directional positions. The clarity of this system helps reduce impulsive actions.
Stop placement also becomes structured using these elements. Instead of arbitrary levels, traders can hide exits below major nodes or outside the value area. Pullback entries gain more stability because they rely on returning to recognized zones where activity is naturally expected to appear again. This style improves discipline, reduces noise trades, and helps form consistent behavior. Over time, such consistency is what shapes strong performance.
Another benefit arises when combining the two tools across different sessions. For intraday work, VWAP carries immediate weight. For swing sessions, the broader distribution from volume profile provides more context. Together, these form a multi-layered approach that aligns short-term action with larger structural cues. This alignment tends to offer some of the cleanest entries because it blends micro and macro views seamlessly.
Mastering this strategy requires practice, chart review, and understanding the evolving structure of each session. But once these elements begin to make sense, the entire market environment feels far more organized. Zones stop looking random, trends gain meaning, and quiet ranges transform into useful information. VWAP and volume profile together create a powerful foundation for any trader looking to enhance structure, clarity, and control in their chart interpretation.