Donchian Channel Logic in Trend Expansion and Market Behavior
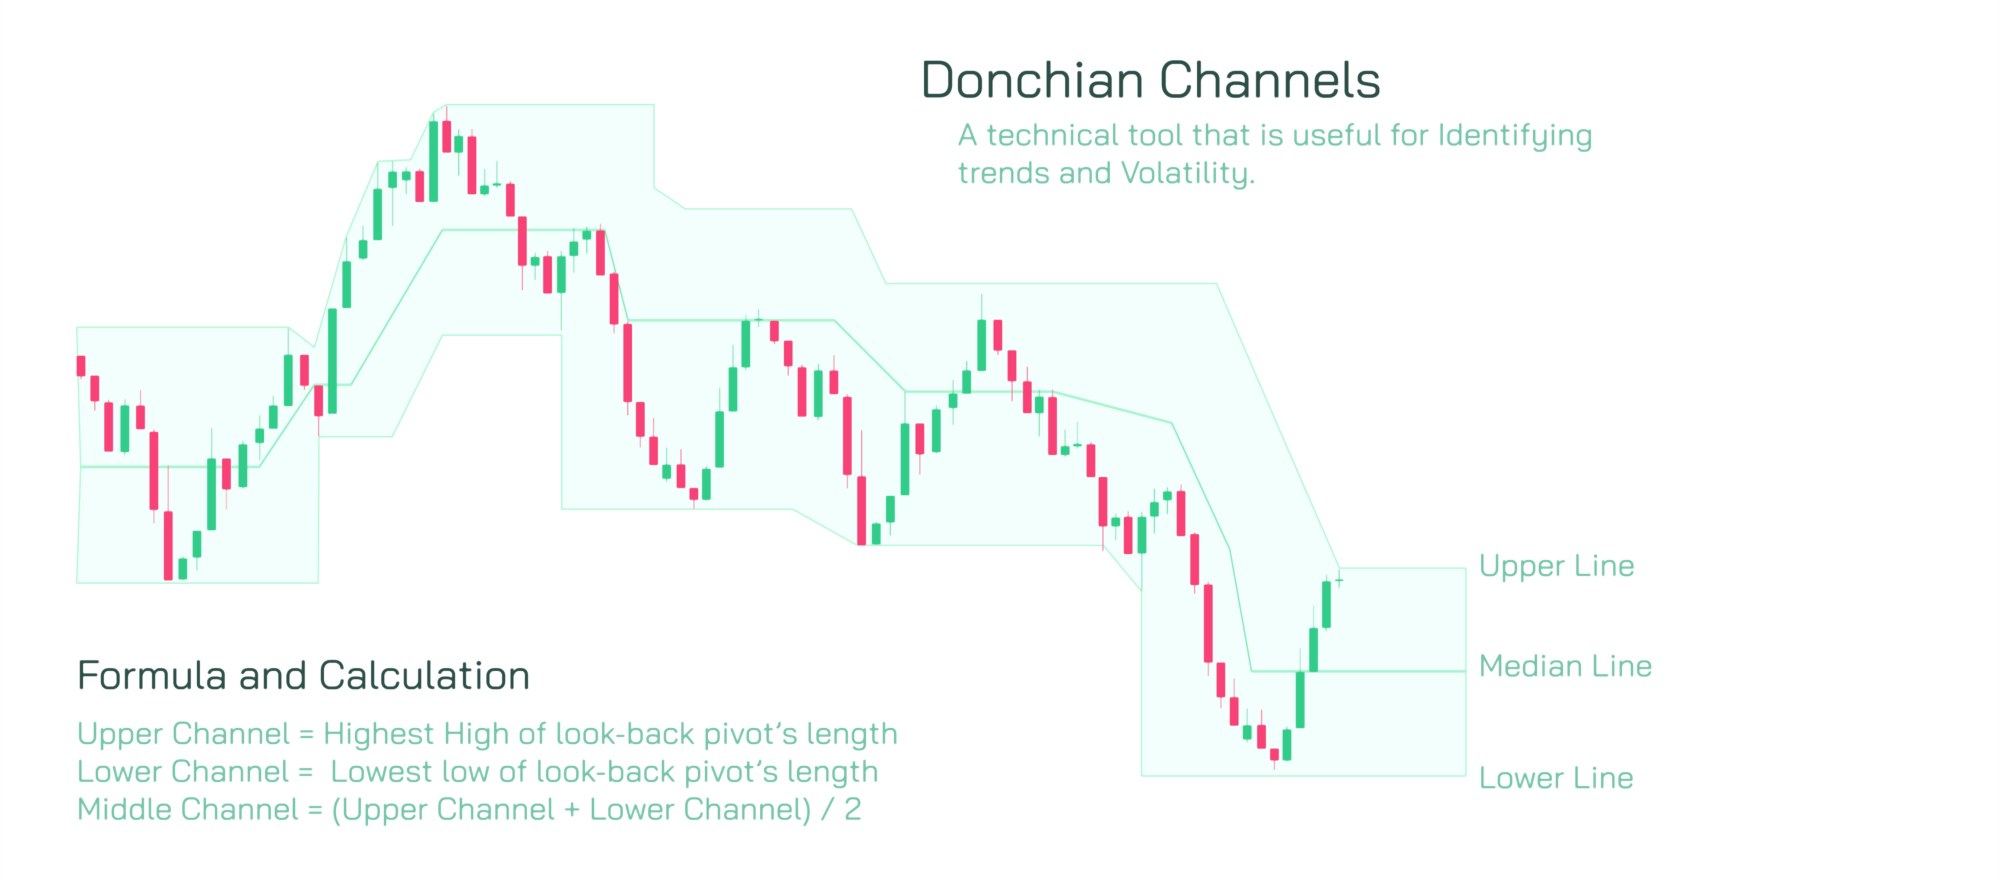
Donchian Channel market analysis offers a clean, rule-based method for understanding price behavior through upper, lower, and mid-range boundaries. Built from the highest high and lowest low over a chosen period, the channel helps reveal how price interacts with volatility, compression, and breakout conditions. The simplicity of this structure makes it powerful for decoding directional shifts, expansion phases, and range control. By observing how waves approach or push through these boundaries, the underlying logic behind market movement becomes far easier to read.
At its core, the Donchian Channel shows where price has recently been contained. The upper boundary reflects the extreme high of the selected period, while the lower boundary marks the extreme low. When price remains within these limits, the market stays inside a structural range. As waves build inside this region, they carry clues about pressure and intent. The narrowing or widening of distance between boundaries reflects changes in volatility, helping analysts anticipate whether momentum is building toward expansion or consolidating for a later move.
Trend expansion becomes evident when price repeatedly tests a boundary with growing energy. When waves press toward the upper band, upward interest is strengthening. Each approach reveals an attempt to explore higher ground. If a wave finally breaks through the band with smooth continuation, it suggests the birth of a fresh directional phase. These breaks often align with rising activity and stronger bars, confirming that the upward push has meaningful participation. The same logic applies when price pushes through the lower band, signaling downward trend expansion with equal clarity.
Range behavior plays a central role in Donchian Channel reading. Inside a broad range, price creates oscillations that display balance between opposing sides. The boundaries become reference points for repeated rejection. Over time, waves shorten or stretch as internal forces shift. A narrowing range indicates compression, which typically precedes strong directional moves. A widening range shows greater volatility and less predictable movement. Observing changes in boundary distance provides early insight into upcoming transitions.
Break zones, created when price crosses a boundary, represent moments when containment gives way to exploration. A true break continues with aligned waves. Bars move consistently in the breakout direction, and pullbacks remain controlled. A weak break lacks this alignment, causing price to fall back into the channel. Such traps often indicate deeper structure at work, with the failed move serving as a clue that pressure may soon shift in the opposite direction. Recognizing the difference between genuine expansion and temporary attempts prevents misinterpretation of erratic movement.
Inside the channel, the mid-region also offers guidance. When price travels between the upper and lower bands with balanced waves, the environment often remains neutral. If price begins pressing consistently toward one side, the bias becomes visible. Watching these internal waves helps uncover whether buyers or sellers are gradually gaining influence. Each touch, rejection, or controlled pullback supplies additional confirmation. Donchian analysis thrives on these small but consistent clues.
Context strengthens the channel’s meaning. A breakout after a long, tight range often implies strong expansion potential. A breakout after high volatility may struggle to sustain movement. Understanding where the channel forms within the larger landscape—whether inside a broader trend or within a multi-day balance—helps determine the quality of each signal.
Overall, Donchian Channel analysis provides clarity by turning complex market waves into structured, easy-to-interpret boundary interactions. It captures trend expansion, range tightening, volatility behavior, and break logic with simple visual cues. By studying how price behaves relative to these boundaries, analysts gain deeper insight into momentum shifts, directional transitions, and the evolving rhythm of market behavior.