Understanding Open Interest Through Fear and Greed in Market Trends
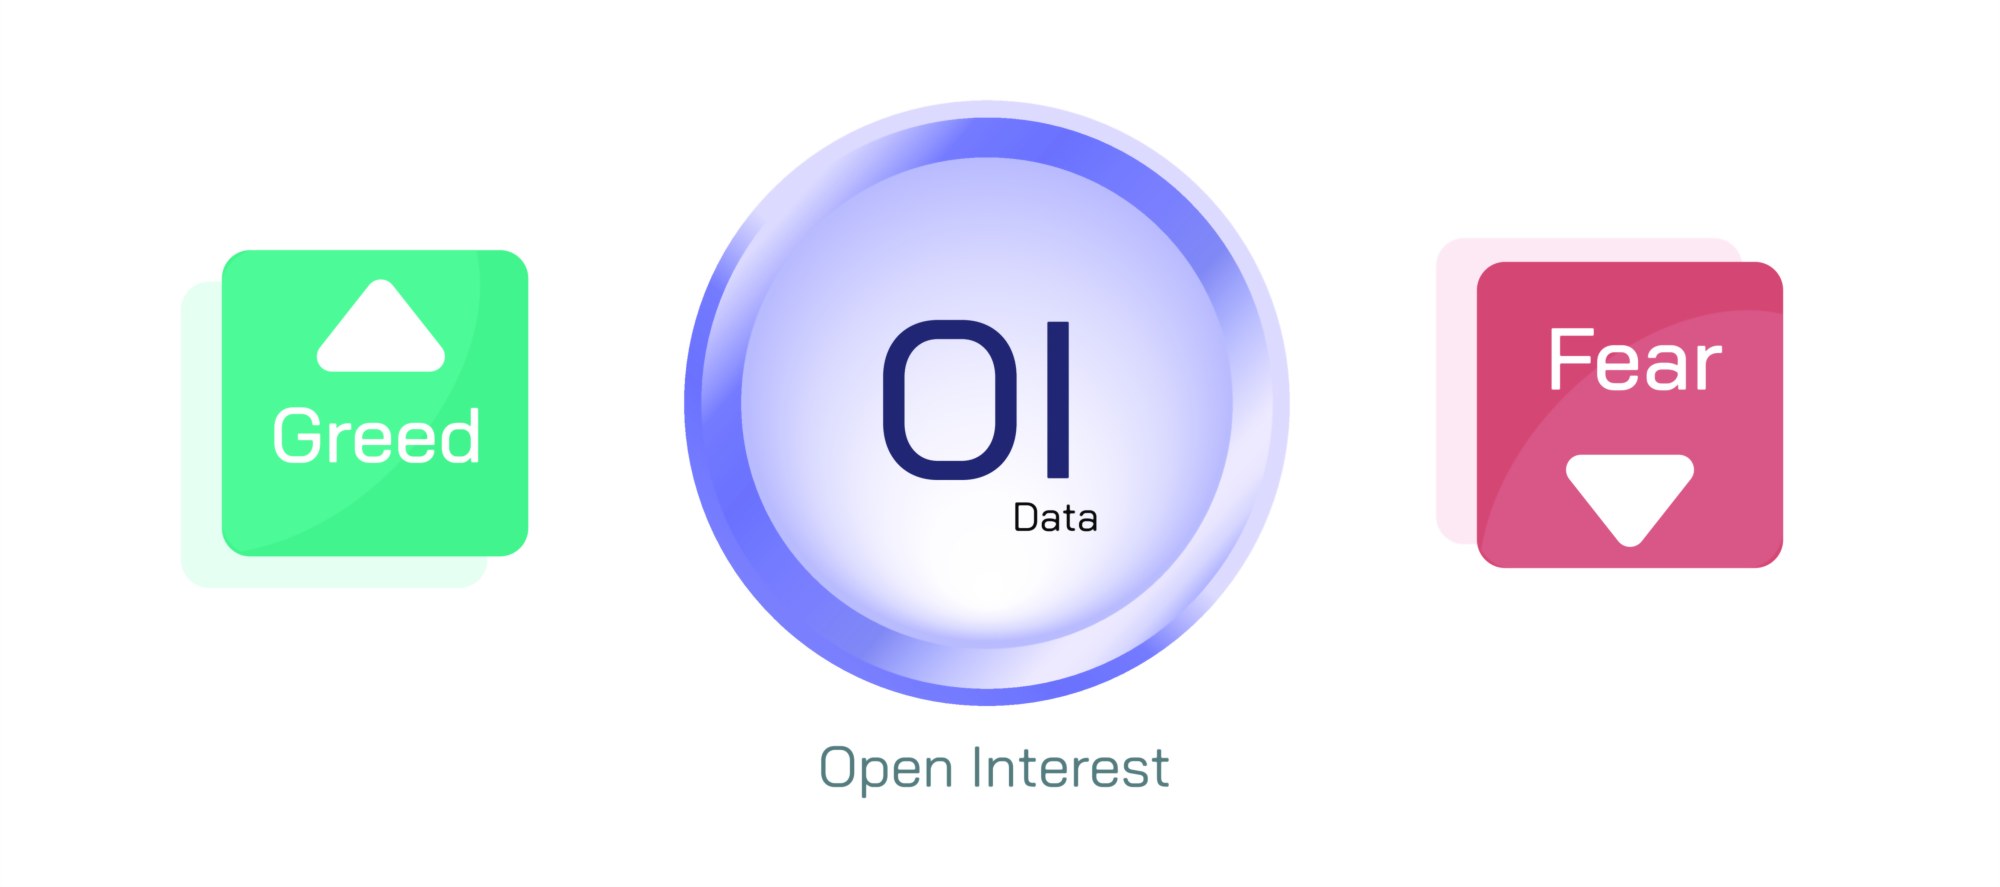
Open interest is one of the most powerful yet misunderstood indicators in futures and options trading. It represents the total number of outstanding contracts that remain open at the end of a trading session. Unlike volume, which resets every day, open interest accumulates or reduces based on whether traders add or close positions. When analyzed correctly, it reveals the psychological foundation of the market—fear, greed, confidence, uncertainty, and the tug-of-war between buyers and sellers. Because futures and options are leveraged instruments, changes in open interest directly reflect how aggressively market participants commit to a directional view.
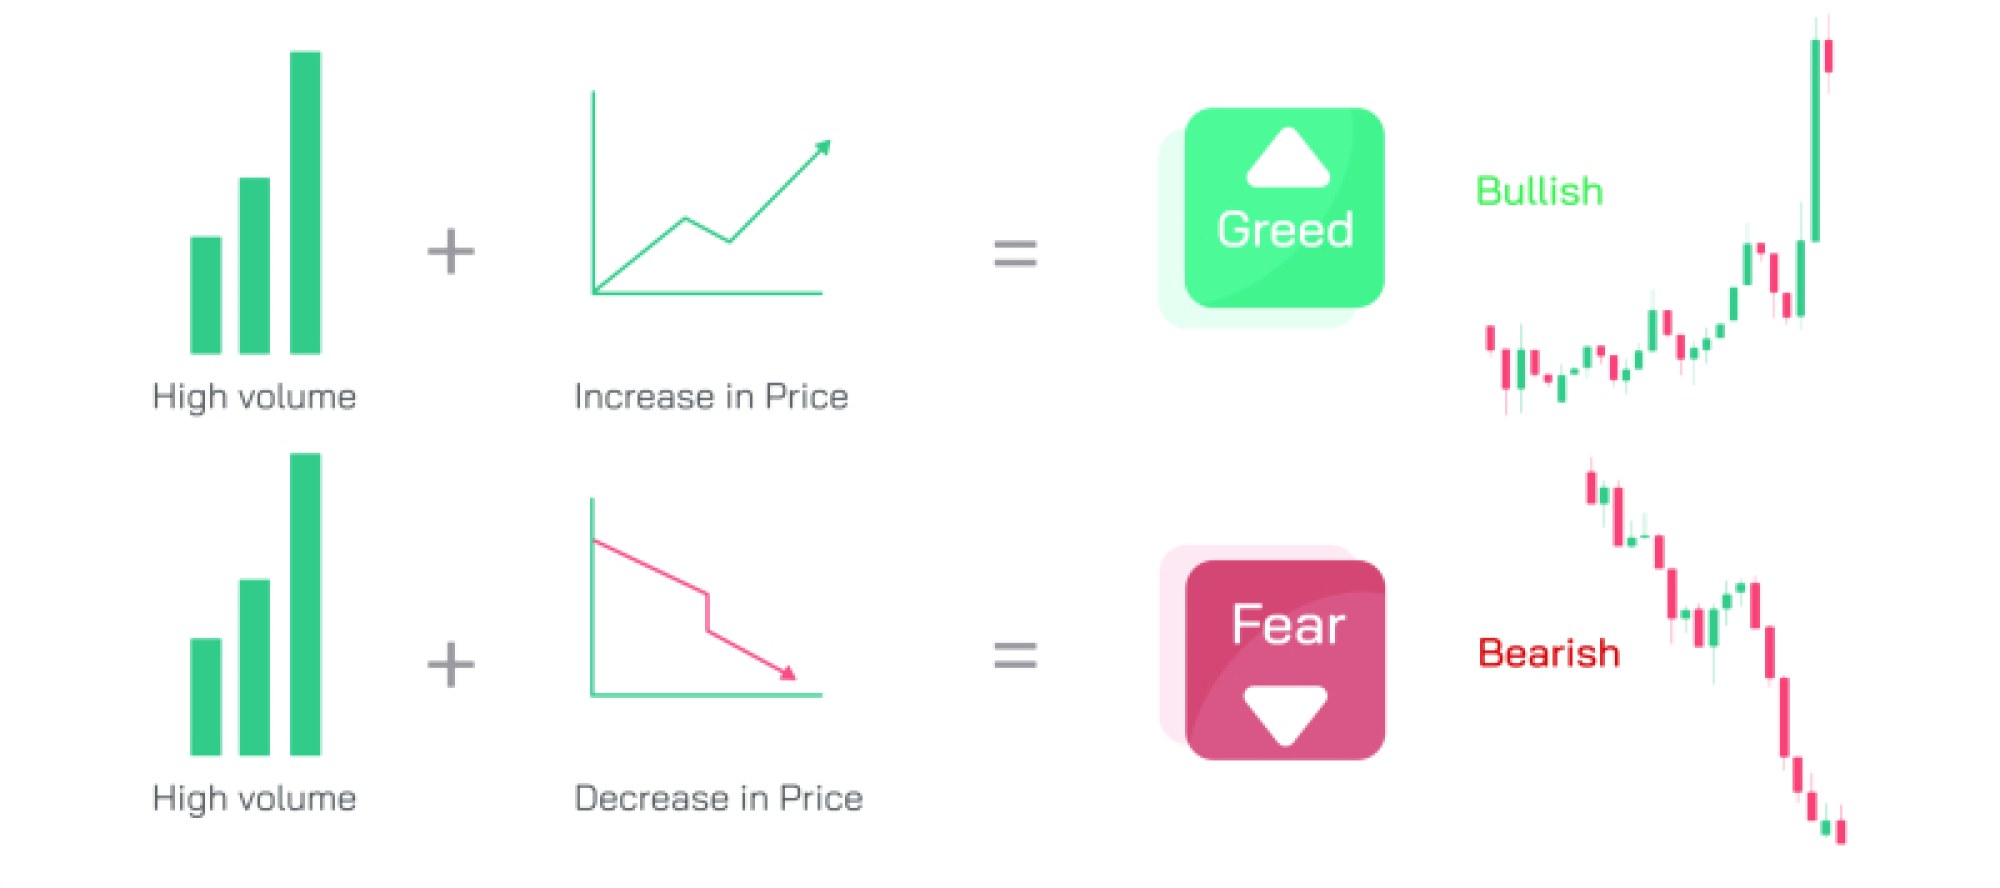
In a rising market, increasing open interest often indicates greed-driven participation. Traders are willing to take on new long positions, expecting higher prices. This behavior shows confidence, momentum, and the likelihood of a continuation. When price climbs but open interest falls, the market signals caution. Such a pattern often reflects short covering rather than genuine buying enthusiasm. Prices may rise temporarily, but the shrinking contract base suggests fear among participants who are reducing exposure. As greed turns to fear, strength transforms into weakness, and the trend stands vulnerable to reversal.
In declining markets, rising open interest typically signifies aggressive short positions. This behavior indicates strong conviction from sellers expecting lower prices. Fear fuels this phase as traders rush to protect capital or speculate on downward movement. When price falls but open interest contracts, the trend weakens. This is often due to profit-booking or panic closures among short sellers. The absence of fresh positions reveals fading confidence and the possibility of a reversal or stabilization. The market enters a zone of uncertainty as both fear and greed attempt to dominate.
Open interest becomes most revealing during breakout and breakdown scenarios. For a breakout to be reliable, open interest must expand alongside strong price movement. This confirms participation from large traders who are not merely reacting but actively committing capital. Combined with rising volume, it becomes a clear signal of greed-driven momentum. A breakout with falling open interest is often a trap. The market may appear strong, but underlying traders are not supporting the move. Fear may be creeping in as participants hesitate to add new positions.
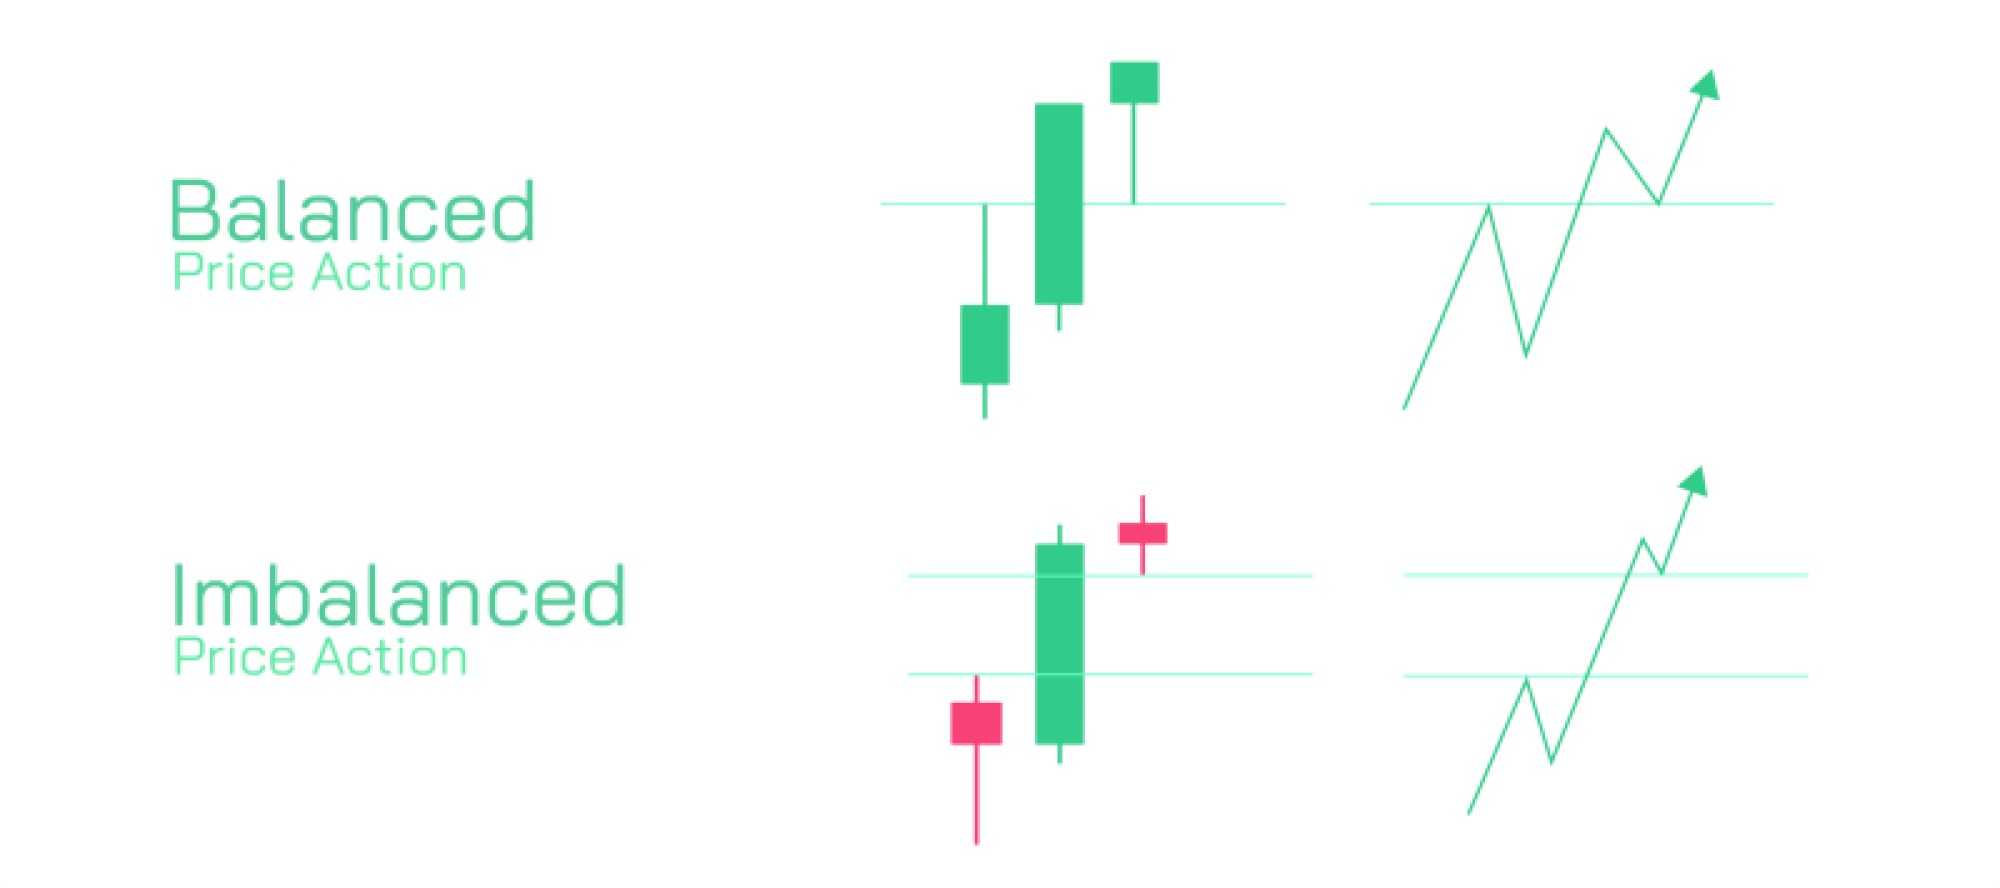
During range-bound phases, open interest behaves differently. When the market moves sideways with rising open interest, both buyers and sellers are creating positions within confined levels. This buildup generates pressure that eventually resolves into a powerful breakout. Fear and greed accumulate beneath the surface as traders attempt to predict direction. When ranges form but open interest remains flat or declines, the market lacks commitment. Such phases lead to weak breakouts that often fail quickly, frustrating both buyers and sellers.
Fear and greed influence how traders manage existing positions. A rapid surge in open interest during volatile events can indicate panic-driven hedging or speculative aggression. Conversely, a sudden drop may reveal widespread fear as traders exit the market to avoid uncertainty. Large players, sometimes called strong hands, use these emotional shifts to identify opportunity. They watch for exhaustion in open interest to time entries and exits. Retail traders, often driven by emotion, leave behind patterns visible through open interest metrics.
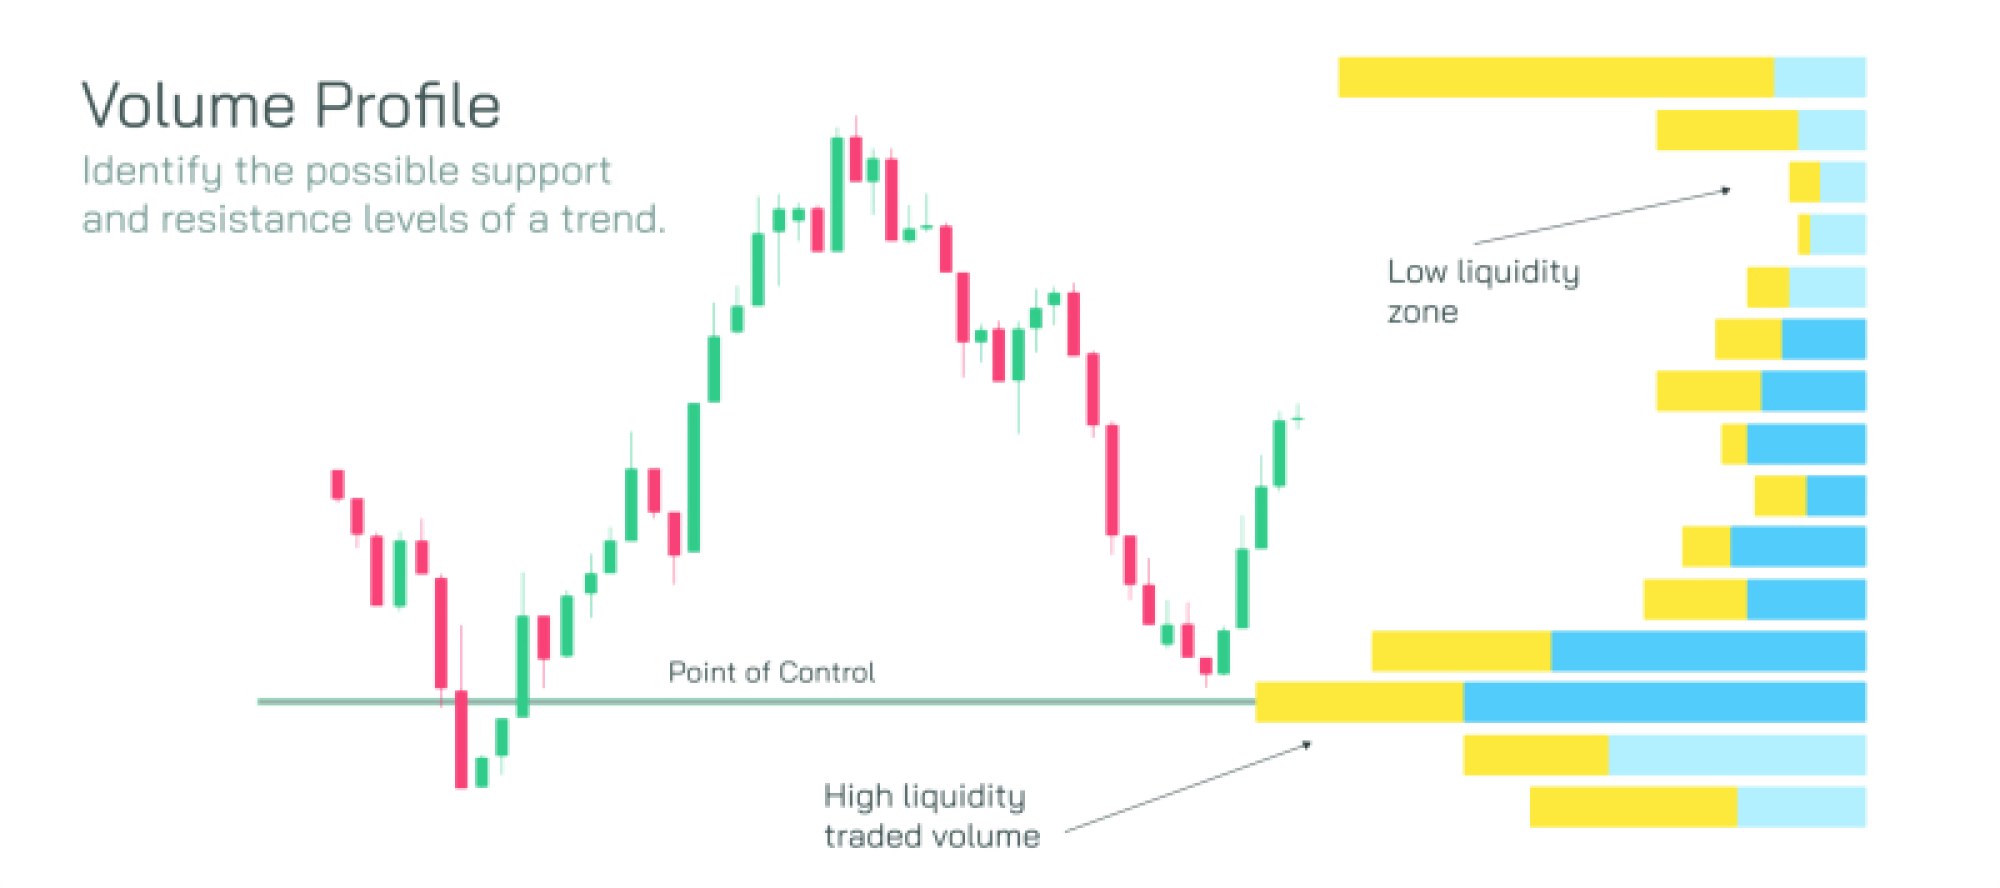
Understanding open interest helps traders interpret the real strength behind price movement. When used with support, resistance, volume, and trend structure, it reveals whether the market is being fueled by emotional reaction or strategic positioning. Fear and greed are not just mental states—they are quantifiable energy forms inside the contract count. Open interest shows the hidden pressure behind every candle on the chart, allowing traders to navigate trends with deeper clarity and confidence.