Understanding the Central Pivot Range and Its Market Logic
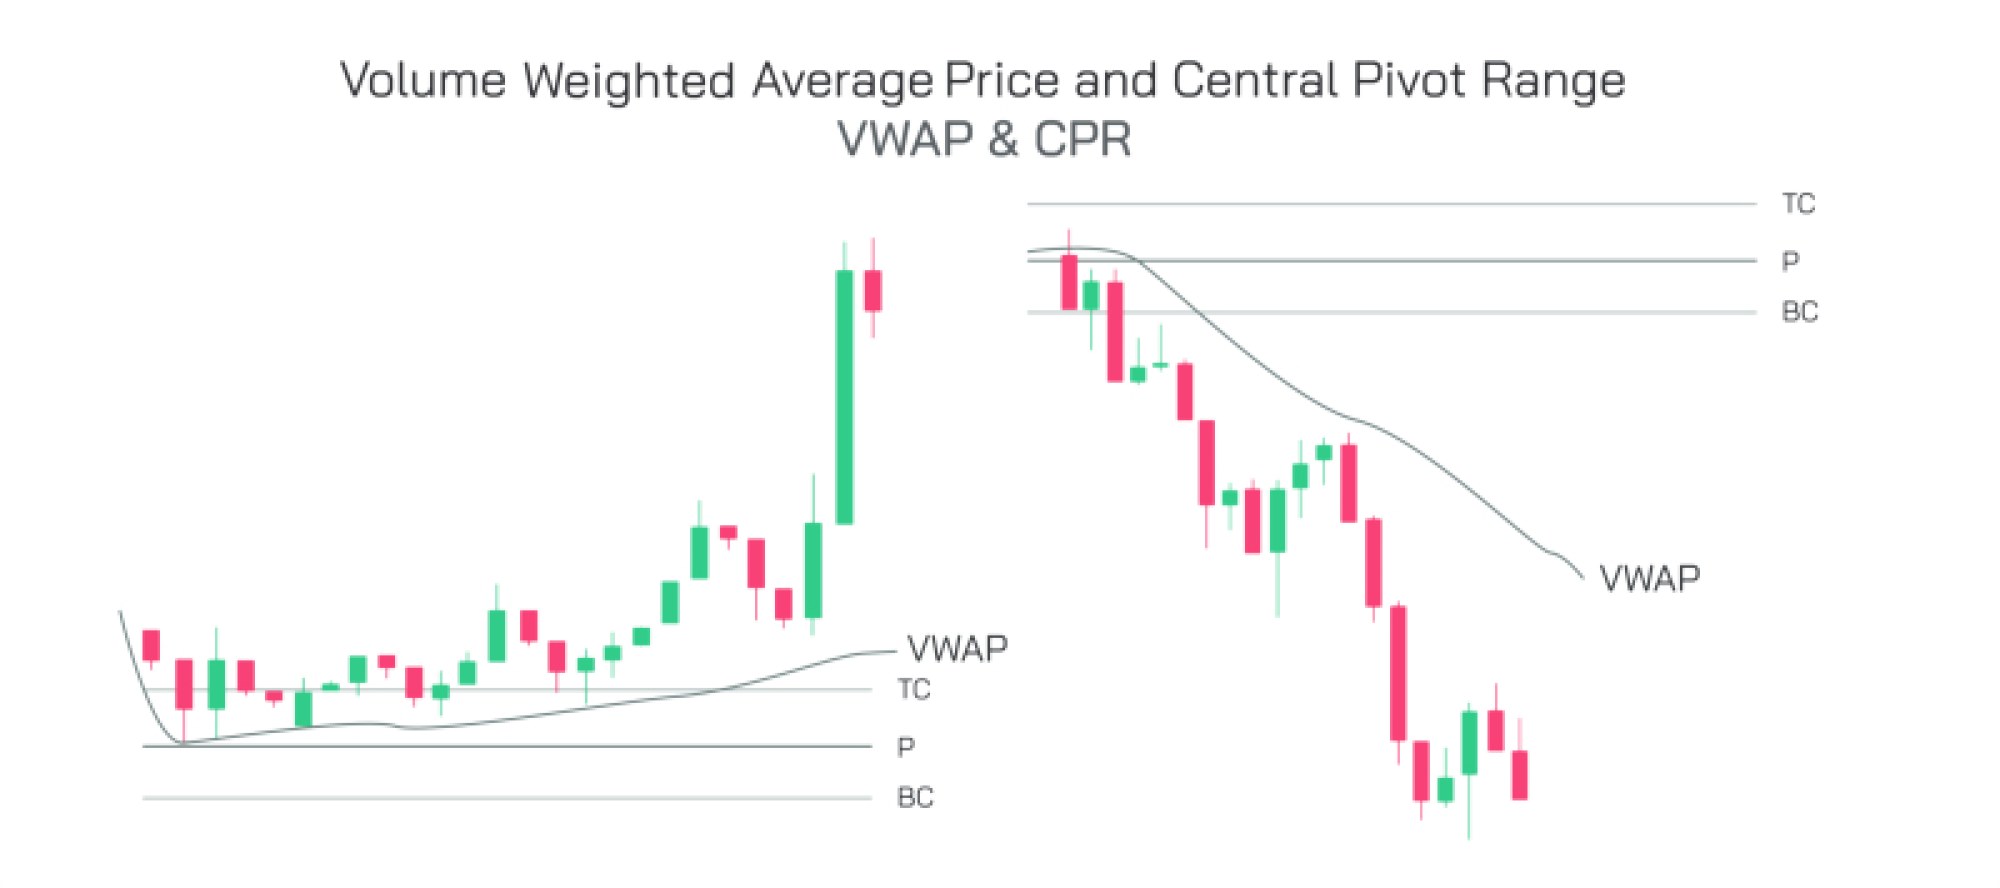
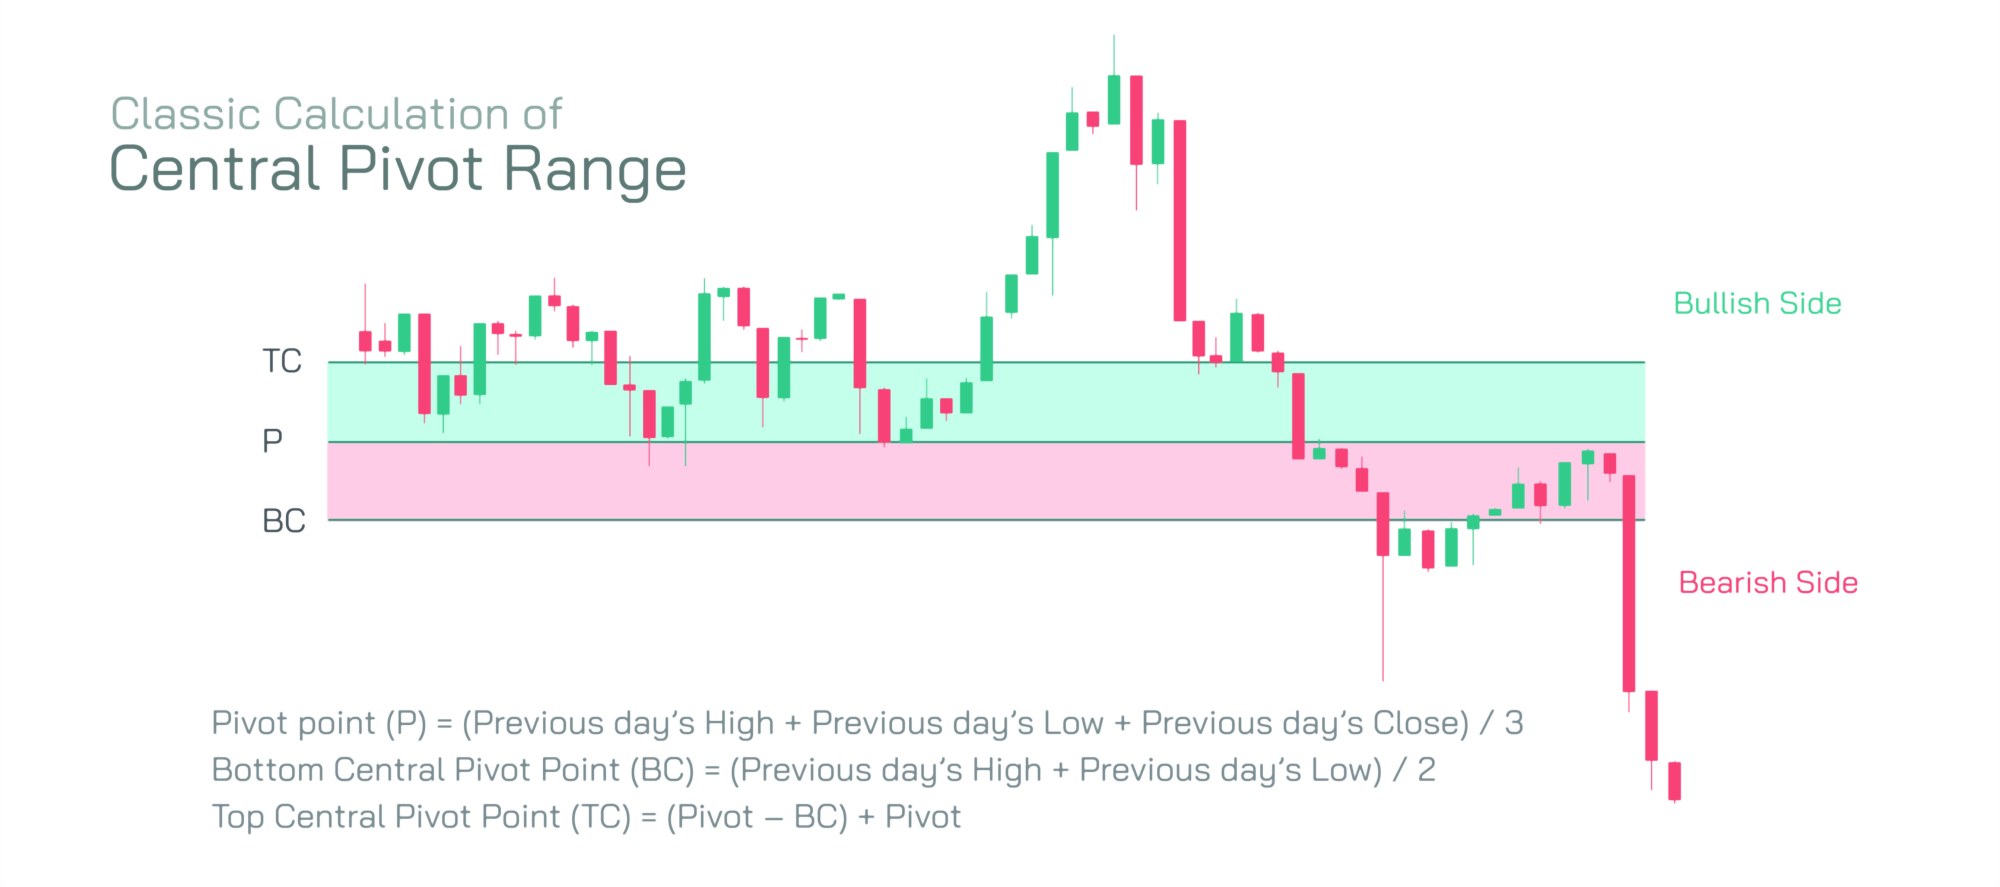
The Central Pivot Range, commonly known as CPR, is a structural tool used to understand market behavior and identify directional bias. It is built from three levels: the main pivot, the top band, and the lower band. These three levels form a zone that captures the balance point for the session. Instead of offering a single value, CPR creates a compact region that provides clarity about trend strength, pressure, and expected flow. Observing how price interacts with this region reveals several meaningful clues about the broader environment.
The central band acts as the core level. It represents the equilibrium zone where the market finds a neutral point. When price remains near this region at the start of the session, the environment often displays balanced behavior. Waves become controlled, and no clear side dominates. This neutral state allows movement to unfold gradually. When price begins to leave this area with energy, the direction of that move gains importance. The way the first waves behave after leaving the region often sets the tone for the session.
The distance between the top band and lower band gives additional insight. A narrow range between these levels signals compression. This compression suggests that stronger movement may appear during the session as energy builds within the condensed region. When the band becomes unusually tight, it often indicates the possibility of expansion. Wide ranges represent the opposite environment. A broad region suggests that prior movement involved substantial activity, which may lead to slower behavior during the next session. Observing the width helps anticipate the degree of movement to expect.
Price location relative to CPR provides directional clues. When price remains above the zone, it displays a positive bias. Waves often attempt to move higher, and any dips toward the region become tests of strength. If the zone holds during these tests, it shows continued control by buyers. When price stays below the region, the environment leans negative. Any effort to climb into the zone becomes an examination of strength from the opposite side. These interactions help define the ongoing trend behavior and clarify which direction holds structural support.
The manner in which price reacts to the region is equally important. A strong push through CPR with notable movement suggests a shift in control. When the move occurs with energy, subsequent waves begin forming in alignment with the break. If price crosses the region without conviction, the environment becomes uncertain. These weak transitions often result in oscillation. This oscillation reflects a tug-of-war between sides, making the region a central zone for repeated tests. Observing these tests provides insight into which side holds more influence.
The CPR is also used to gauge strength during intraday progression. When price starts above the zone and continues rising without testing the region, it indicates strong upward control. If price later returns to the central band and holds, the zone becomes a foundation for continued movement. When price breaks below CPR after holding above it earlier, the shift signals a significant change in pressure. This switch often leads to attempts toward new regions, providing meaningful turning points for the day.
Another powerful aspect of CPR is its ability to reflect exhaustion. When price approaches the region from above and enters with heavy activity, it may signal weakening momentum. If the region fails to provide support, the environment often begins forming a new directional bias. Observing how price interacts with the boundaries reveals where demand or supply begins fading. These clues help identify whether the ongoing trend is stable or nearing a transition.
The logic behind CPR becomes clearer when combined with wave behavior. A breakout above or below the zone gains reliability when the waves unfold smoothly with supporting activity. A move lacking alignment often results in traps. This alignment-based reading reduces confusion and provides structure to intraday analysis. The region becomes a pivoting reference that helps track whether price behaves in harmony with expected flow.
The Central Pivot Range remains widely used because it offers clarity, balance understanding, and directional interpretation. It summarizes the market’s center of gravity and creates a framework to observe behavior in a structured way. By learning how price interacts with this zone, one gains insight into strength, weakness, compression, and expansion across different sessions.