Color Spectrum, Hydrogen Emission Spectrum, and Hydrogen Absorption Spectrum Vector Illustration Showing Wavelength and Energy Transitions
The study of light and atomic spectra forms a cornerstone of physics and chemistry, linking visible color perception to atomic energy levels and electron transitions. A vector illustration combining the color spectrum, hydrogen emission spectrum, and hydrogen absorption spectrum provides a comprehensive visual explanation of how wavelength, energy, and electron transitions are interrelated. By integrating color-coded bands, labeled spectral lines, and energy transition arrows, such illustrations allow learners to connect macroscopic observations of light with microscopic atomic behavior, making complex quantum phenomena accessible and intuitive.
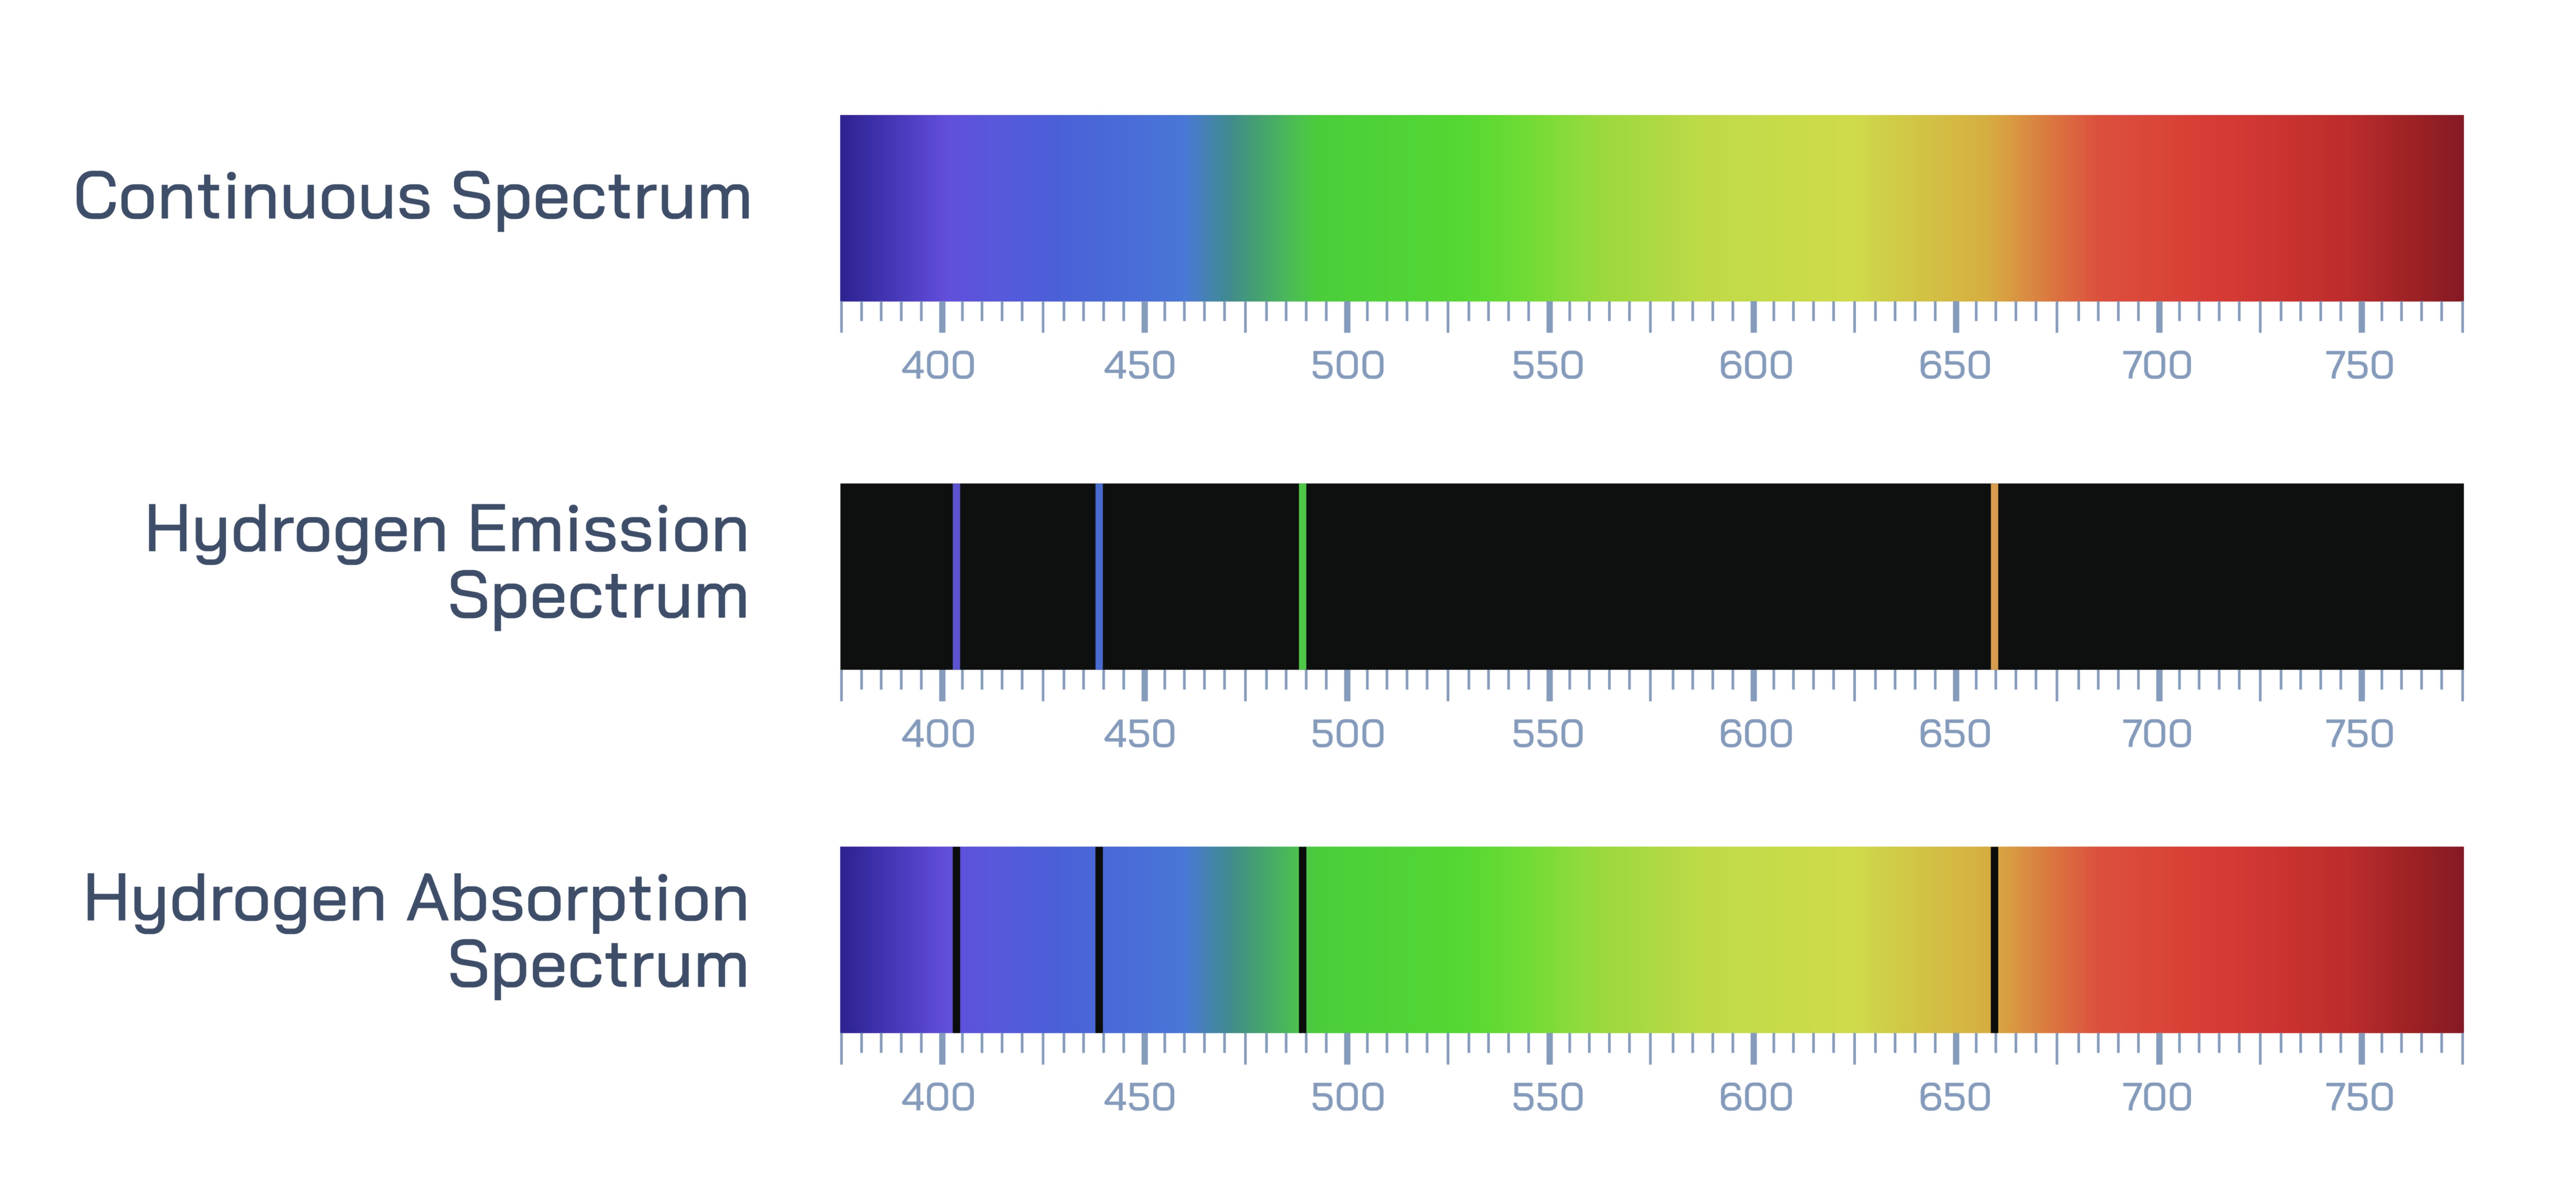
At the center of the illustration is the visible color spectrum, showing the continuous range of wavelengths perceived by the human eye. Vector diagrams typically present this spectrum as a rainbow gradient, ranging from violet (~380 nm) to red (~700 nm). Each color band is labeled with its corresponding wavelength and approximate energy, demonstrating the inverse relationship between wavelength and photon energy. Arrows or annotations indicate that shorter wavelengths correspond to higher-energy photons, providing the foundation for understanding atomic emission and absorption phenomena.
The hydrogen emission spectrum is prominently illustrated with discrete spectral lines, representing light emitted when electrons in hydrogen atoms transition from higher energy levels to lower levels. The vector diagram often highlights the Balmer series in the visible region, showing four main spectral lines: violet (410 nm), blue (434 nm), cyan/green (486 nm), and red (656 nm). Each line is labeled with its corresponding wavelength, color, and electron transition (e.g., n=6→n=2), visually linking photon emission to specific energy changes in the atom. Color-coded arrows indicate electron descent between energy levels, demonstrating the quantization of energy and the production of visible light.
Adjacent to the emission spectrum, the hydrogen absorption spectrum is illustrated, showing dark lines superimposed on a continuous rainbow background. These lines correspond to wavelengths absorbed by hydrogen atoms when electrons are excited from lower to higher energy levels. Vector diagrams include labels indicating the same wavelength positions as the emission spectrum, demonstrating energy conservation: photons absorbed correspond exactly to the photons emitted in emission processes. Arrows may point upward, indicating electron excitation from n=2 to higher levels, reinforcing the principle that absorption occurs when energy matches the difference between atomic energy levels.
The illustration frequently incorporates energy level diagrams of the hydrogen atom, showing the ground state (n=1) and excited states (n=2, n=3, n=4, etc.). Vertical arrows indicate electron transitions responsible for the emission or absorption of photons, with labels specifying the energy difference (ΔE) associated with each transition. Color-coded arrows correspond to the spectral lines, linking energy transitions directly to observed wavelengths and perceived colors. This visually integrates abstract quantum energy levels with tangible spectral observations.
Vector diagrams may include comparative panels showing the relationship between the continuous visible spectrum and the discrete spectral lines. This emphasizes that while sunlight or white light produces a continuous spectrum, individual atoms, like hydrogen, produce discrete emission or absorption lines corresponding to specific energy differences. Shading, dashed lines, or overlays can indicate the precise positions of spectral lines within the continuous spectrum, clarifying the connection between emission, absorption, and color perception.
Additional features often depicted include electron orbit labels, photon direction arrows, and wavelength-energy correlation graphs. Arrows may show emitted photons traveling outward in emission spectra or absorbed photons exciting electrons in absorption spectra. Small magnified panels may illustrate atomic transitions at a microscopic scale, providing a direct link between visible spectral lines and atomic-level quantum mechanics.
Vector illustrations also highlight energy-wavelength relationships, often including a side scale showing photon energy (in eV) inversely proportional to wavelength, reinforcing the concept that shorter-wavelength violet light has higher energy than longer-wavelength red light. Comparative arrows between absorption and emission lines demonstrate that energy absorbed by an electron is equal to energy emitted during de-excitation, illustrating energy conservation in atomic processes.
By combining continuous color spectrum, hydrogen emission lines, hydrogen absorption lines, energy level diagrams, and labeled electron transitions, a vector illustration provides a comprehensive visualization of light-matter interactions. Color coding, wavelength labeling, energy arrows, and magnified atomic representations help learners understand the physical and quantum principles underlying spectral phenomena. This approach bridges macroscopic light observations with microscopic atomic structure, reinforcing both scientific and educational understanding.
Ultimately, a vector illustration of the color spectrum, hydrogen emission, and absorption spectra demonstrates the interconnection between wavelength, photon energy, and atomic transitions. Through labeled spectral lines, color gradients, energy-level arrows, and absorption-emission comparisons, the diagram transforms abstract quantum mechanics concepts into an accessible and visually intuitive educational framework. Learners can see how electron energy changes produce observable light, how specific wavelengths correspond to particular transitions, and how atomic structure governs the diversity of visible and invisible spectra.