Dynamic Equilibrium Vector Illustration Showing Forward and Reverse Reaction Balance in Chemical Processes and Reaction Rate Stability
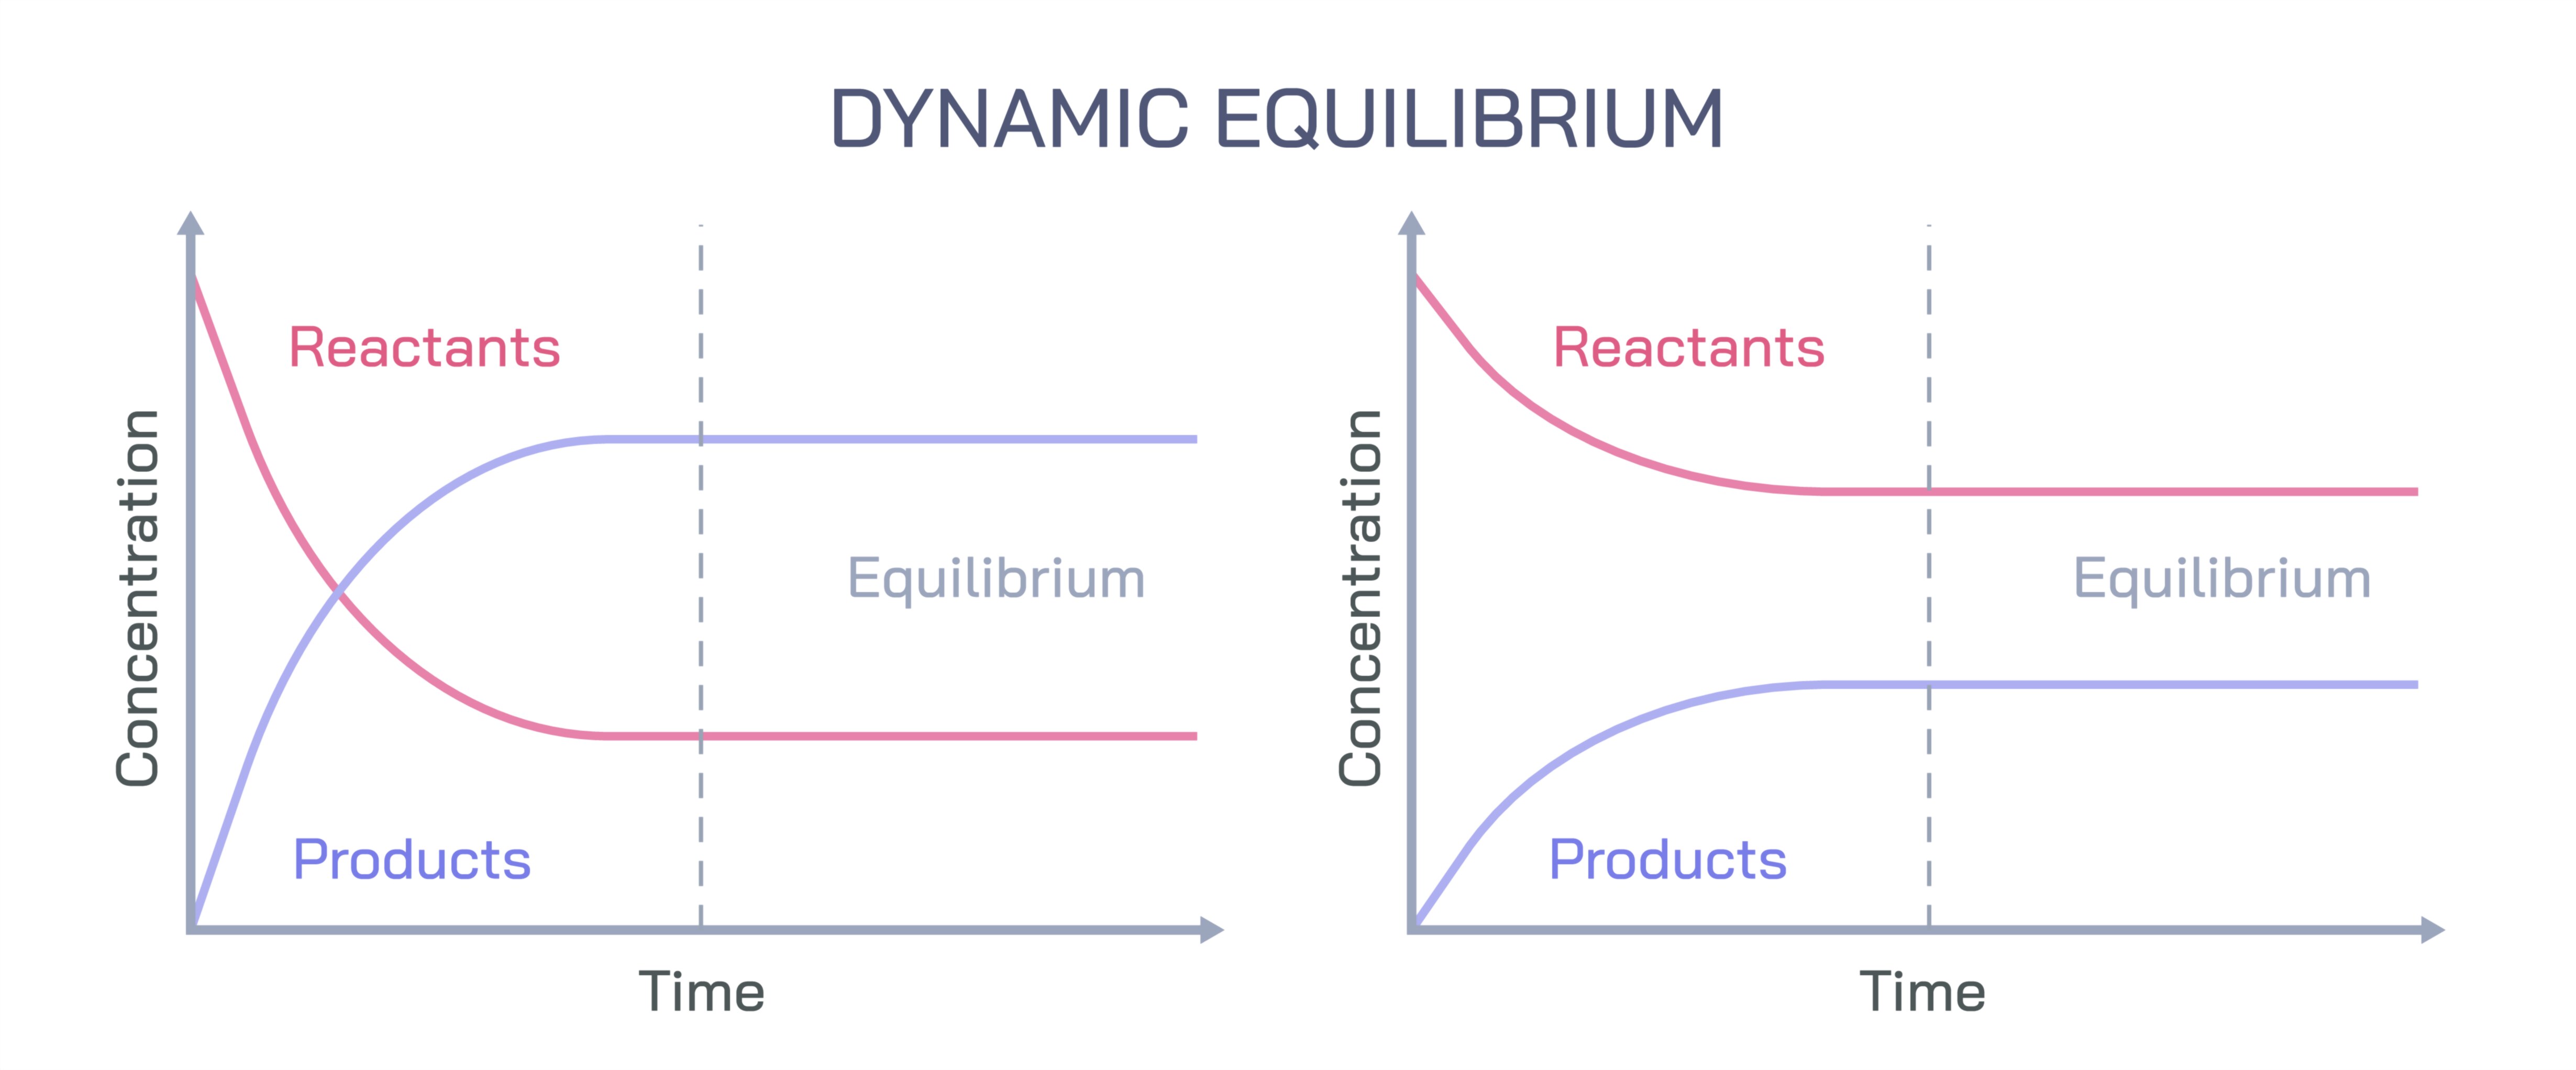
Dynamic equilibrium is a fundamental concept in chemistry that describes a state in which the rate of the forward chemical reaction equals the rate of the reverse reaction, resulting in no net change in the concentrations of reactants and products over time. Unlike static equilibrium, dynamic equilibrium emphasizes that molecular activity continues in both directions, with reactions proceeding simultaneously. A vector illustration of dynamic equilibrium typically integrates reactant and product molecules, directional arrows representing forward and reverse reactions, and indicators of rate balance, providing a clear and intuitive depiction of how chemical equilibrium is maintained. By combining labeled species, rate arrows, and concentration indicators, such illustrations convey the abstract concept in a visually accessible and educational manner.
At the center of the illustration is a reaction vessel or system, often depicted as a closed container to emphasize that no matter enters or leaves, ensuring that the system can reach equilibrium. Inside the container, reactant molecules (A, B, etc.) and product molecules (C, D, etc.) are shown as distinct colored spheres, dots, or icons, providing a visual distinction between species. Arrows above and below the molecules indicate the forward reaction (reactants to products) and reverse reaction (products to reactants). These arrows are typically of equal length and thickness to symbolize that at equilibrium, the reaction rates are equal, even though molecules continue to interact and transform.
The illustration often includes time-dependent elements, such as a sequence of panels or fading arrows, showing that initially, the forward reaction may dominate, increasing product concentration. Over time, the reverse reaction accelerates as product concentration rises, while the forward reaction slows as reactant concentration decreases. When the system reaches dynamic equilibrium, arrows representing both reactions are equal in size, demonstrating rate balance and no net change in concentrations. Labels such as “forward rate = reverse rate” reinforce this critical concept.
Concentration indicators may also be incorporated to visually convey the concept of equilibrium concentrations. Graphical elements such as small bar graphs, shading, or proportionally sized molecule clusters can illustrate that although individual molecules are continually reacting, the overall number of reactants and products remains constant. This visually reinforces the distinction between a chemical reaction that has stopped and one in dynamic equilibrium, where molecular motion and transformation continue.
Vector diagrams often include Le Chatelier’s principle annotations, showing how changes in concentration, pressure, or temperature affect dynamic equilibrium. For example, arrows may indicate that adding more reactant shifts the system toward more product formation, while removing product shifts equilibrium toward replenishing it. Temperature effects can be illustrated with energy bars or heat symbols, demonstrating endothermic and exothermic reactions’ responses to thermal changes. This inclusion emphasizes the stability and adaptability of dynamic equilibrium in response to external disturbances.
In addition, molecular-level magnification is frequently included in vector illustrations. Insets may depict individual molecules colliding and reacting in both directions, with small arrows indicating transitions between reactant and product forms. This micro-level view helps learners understand that dynamic equilibrium is not a static state but a continuous, balanced molecular exchange, bridging observable macroscopic concentrations with microscopic activity.
Vector illustrations may also highlight reaction reversibility by labeling reactions as reversible (⇌) and including proportional symbols or arrows to indicate that the extent of equilibrium depends on the equilibrium constant (K). While avoiding complex formulas, visual cues such as the relative density of molecules or arrow thickness can indicate whether the system favors reactants or products, illustrating equilibrium position intuitively.
For educational clarity, color coding is used to distinguish reactants, products, and transitional states, while arrows convey both the direction and magnitude of reaction rates. Side-by-side comparisons may show a system before equilibrium, during approach to equilibrium, and at equilibrium, providing a temporal perspective on reaction dynamics. Labels such as “net change = 0” or “concentration stable, reactions ongoing” reinforce key learning points.
By combining reactant and product depiction, forward and reverse rate arrows, concentration indicators, molecular collision insets, and response to changes, a dynamic equilibrium vector illustration provides a complete visual understanding of chemical balance. It emphasizes that equilibrium is dynamic rather than static, showing both ongoing molecular activity and macroscopic stability. Comparative panels, rate arrows, and color-coded molecular clusters make abstract chemical principles accessible, reinforcing comprehension of reaction kinetics, reversibility, and system stability.
Ultimately, a vector illustration of dynamic equilibrium demonstrates the delicate balance between forward and reverse reactions, highlighting how chemical systems achieve stable concentrations through continuous molecular activity. Through labeled molecules, directional arrows, concentration graphics, and temporal progression, the diagram transforms abstract equilibrium concepts into an educational and visually intuitive tool, enabling learners to grasp reaction rate balance, reversibility, and the fundamental principles underlying chemical equilibrium.