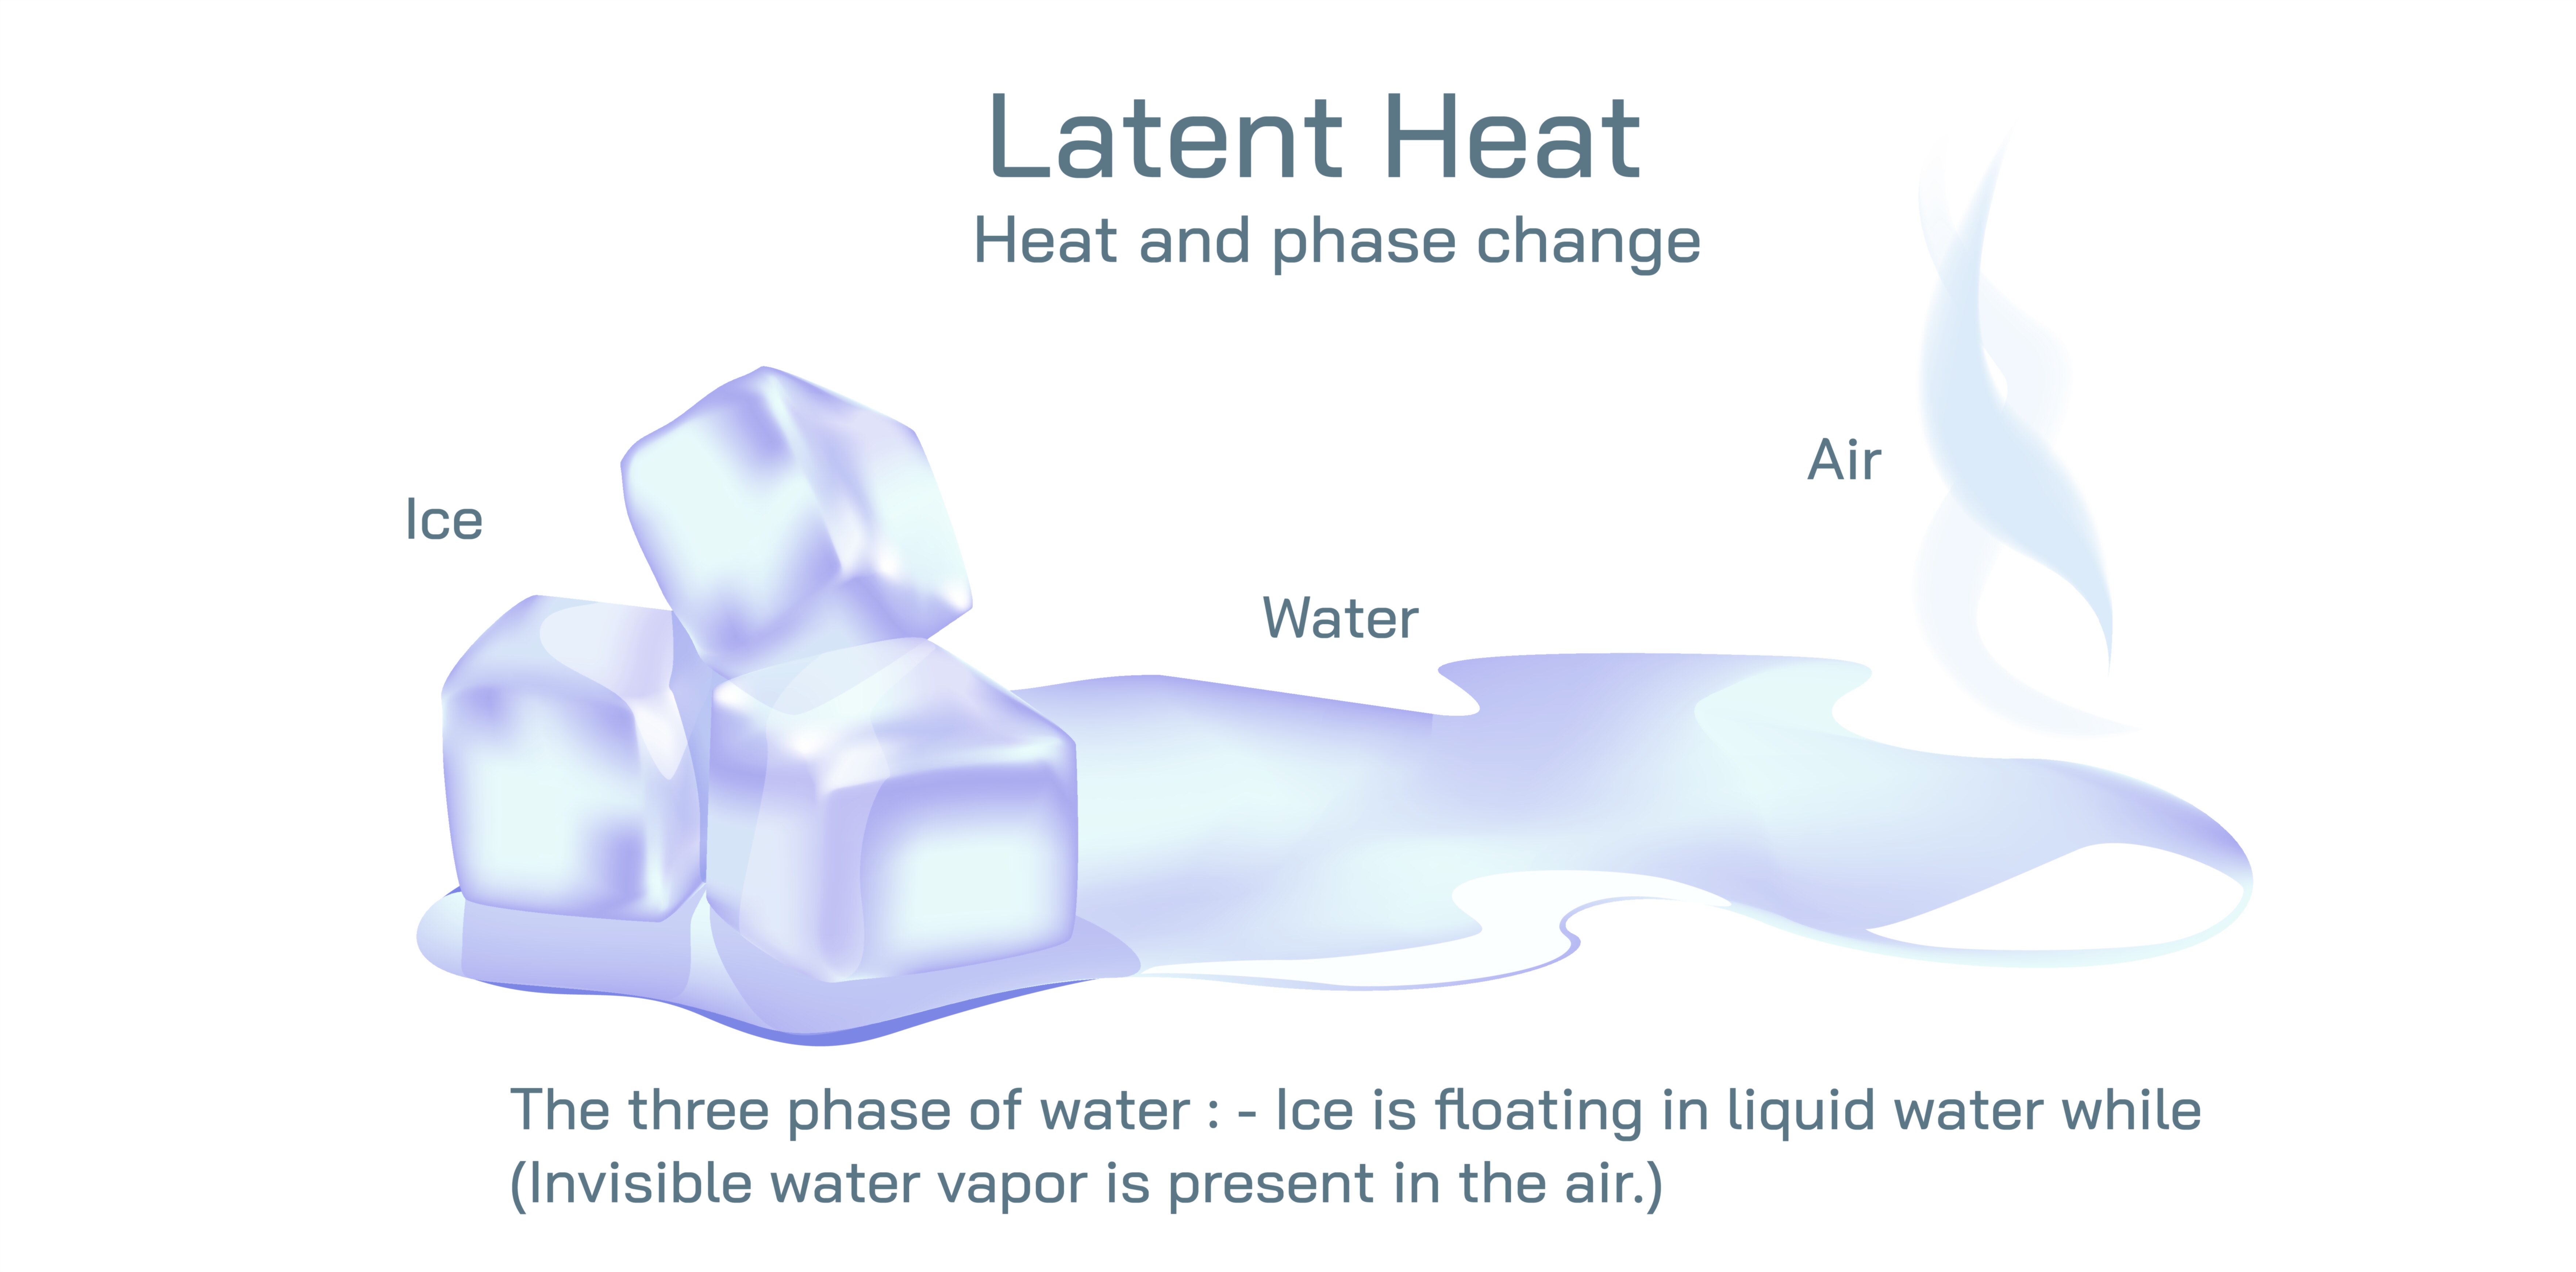
Latent Heat Concept Vector Illustration Showing Phase Change Energy Absorption and Release in Solid, Liquid, and Gas States
Latent heat is a fundamental concept in thermodynamics that describes the energy absorbed or released by a substance during a phase change without a change in temperature. This energy is required to overcome or establish the molecular forces that hold particles together in a particular state, making latent heat essential for understanding melting, freezing, vaporization, condensation, and sublimation. A vector illustration depicting latent heat typically integrates solid, liquid, and gas phases with arrows representing energy flow, allowing learners to visualize how energy transfer occurs during phase transitions. By combining phase diagrams, energy indicators, and molecular behavior, such illustrations provide a clear and educational explanation of latent heat in practical and theoretical contexts.
At the core of the illustration is the depiction of substance phases—solid, liquid, and gas—often represented as distinct containers or regions in a simplified diagram. The solid phase is illustrated with closely packed molecules arranged in a regular lattice, emphasizing strong intermolecular forces and minimal molecular motion. The liquid phase is depicted with molecules slightly more separated, moving more freely while remaining cohesive, while the gas phase shows widely spaced molecules in constant, rapid motion with minimal attractive forces. Arrows and color gradients indicate the flow of energy into or out of the system, visually linking the absorption or release of latent heat with molecular behavior. Labels may identify the specific phase change occurring at each stage, such as melting, vaporization, or condensation.
The melting process (solid to liquid) is highlighted as energy is absorbed from the surroundings to break the structured bonds in the solid lattice. In the vector illustration, arrows point from a heat source toward the solid, indicating energy absorption, while the solid gradually transforms into a liquid. Molecular diagrams may include slight displacement of particles, demonstrating increased freedom of movement, while temperature remains constant during the phase transition. Labels such as “latent heat of fusion” can indicate the specific energy required to melt the solid without a temperature rise, reinforcing the concept of energy absorption during a phase change.
Similarly, freezing (liquid to solid) is illustrated as energy being released from the substance into the surroundings. Arrows point outward from the liquid to indicate heat release as molecular movement slows and particles reorganize into a crystalline lattice. The illustration may depict the reverse process of melting, emphasizing that latent heat is involved in both energy absorption and release, depending on the direction of the phase change. Color gradients or shading can highlight energy transfer, allowing learners to distinguish between endothermic and exothermic processes.
The vaporization process (liquid to gas) is depicted with arrows indicating energy absorption from a heat source, enabling molecules to overcome intermolecular attractions and escape into the gas phase. The illustration often shows molecules moving further apart and with increased kinetic motion, while the temperature remains constant until the phase change is complete. Labels such as “latent heat of vaporization” indicate the energy required to convert a unit mass of liquid into gas at its boiling point, reinforcing the distinction between sensible heat (temperature change) and latent heat (phase change).
Condensation (gas to liquid) is illustrated with arrows pointing away from the gas toward the surroundings, indicating energy release as gas molecules slow down and form intermolecular bonds to become liquid. Molecular diagrams may show particles coming closer together, while the surrounding medium absorbs the released heat. The vector illustration emphasizes that condensation, like freezing, is an exothermic process, in contrast to the endothermic processes of melting and vaporization.
Vector illustrations may also include sublimation (solid to gas) and deposition (gas to solid), showing direct phase changes without passing through the liquid phase. Arrows indicate energy flow either into the system for sublimation or out of the system for deposition, and molecular diagrams display particles moving apart or coming together, providing a comprehensive view of latent heat across all phase transitions. Labels such as “latent heat of sublimation” clarify the energy requirement for these direct transitions.
The diagram often incorporates a simplified phase diagram or energy chart, showing the relationship between temperature, energy input, and phase transitions. Horizontal arrows along constant temperature lines indicate energy absorption or release during phase change, while sloped lines represent temperature change without phase change. Color coding differentiates energy flow, phase states, and phase boundaries, providing a visual framework for learners to connect theoretical concepts with observable phenomena.
Vector illustrations may also depict real-life examples, such as ice melting into water, water boiling into steam, or frost forming on cold surfaces, linking latent heat to everyday experiences. By integrating molecular behavior, energy arrows, and macroscopic phase depictions, the illustration demonstrates how latent heat governs both microscopic and observable transformations.
By combining solid, liquid, and gas phases, energy absorption and release, molecular behavior, and phase transition labeling, a latent heat vector illustration provides a complete, intuitive understanding of how energy interacts with matter during phase changes. The diagram conveys the concept of energy transfer without temperature change, highlighting endothermic and exothermic processes, and clarifies the role of latent heat in physical transformations.
Ultimately, a vector illustration of latent heat demonstrates the dynamic relationship between energy, molecular structure, and phase transitions, linking abstract thermodynamic principles with tangible visual representation. Through labeled phases, directional arrows, molecular depictions, and energy indicators, the diagram transforms a complex concept into an accessible and educational framework, enabling learners to understand how matter absorbs or releases energy during melting, freezing, vaporization, condensation, sublimation, and deposition.