Meiosis Normal vs Abnormal Vector Illustration Showing Chromosome Division Errors and Genetic Variation Differences in Cell Reproduction
Meiosis is a specialized type of cell division responsible for producing haploid gametes—sperm and egg cells—in sexually reproducing organisms. It ensures genetic diversity through recombination and independent assortment of chromosomes while reducing the chromosome number by half. Errors during meiosis can lead to abnormal gametes, resulting in genetic disorders, aneuploidy, or miscarriage. A vector illustration comparing normal versus abnormal meiosis typically integrates chromosome pairing, division stages, errors like nondisjunction, and resulting gametes, providing a detailed, educational, and visually intuitive explanation for learners of biology, genetics, and medicine.
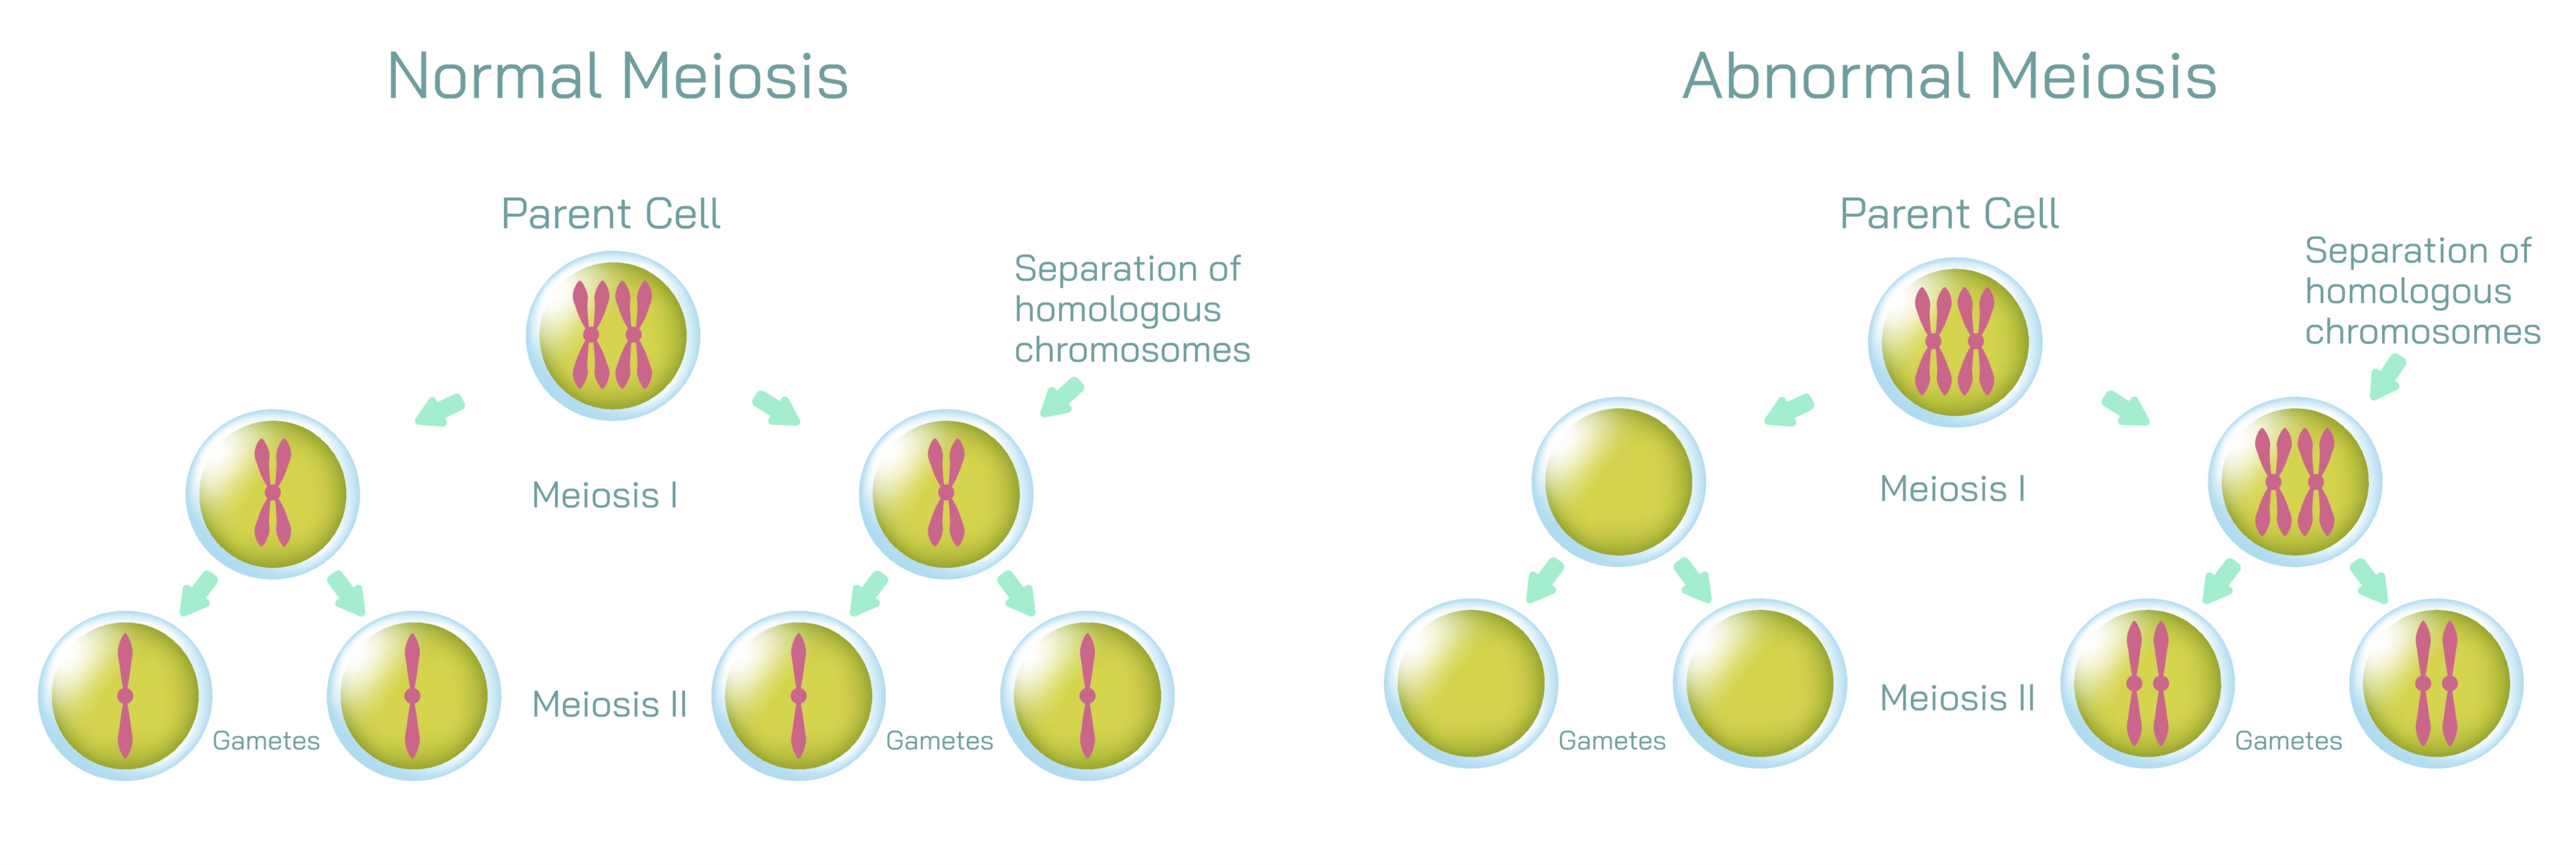
At the center of the illustration is the normal meiosis process, often shown in a stepwise manner across two successive divisions: meiosis I and meiosis II. In meiosis I, homologous chromosomes pair and exchange genetic material through crossing over during prophase I, a feature often magnified in vector diagrams for clarity. Arrows may indicate the separation of homologous chromosomes during anaphase I, with labels showing how each daughter cell receives one chromosome from each pair. Color-coded chromosomes help viewers differentiate maternal and paternal contributions, illustrating the source of genetic variation.
The diagram proceeds to meiosis II, where sister chromatids separate, producing four genetically distinct haploid gametes. Vector illustrations typically depict metaphase II alignment, anaphase II separation, and the resulting gametes, emphasizing that each gamete contains half the original chromosome number with unique genetic combinations. Labels and color gradients are often used to highlight recombination events and independent assortment, reinforcing the principles underlying genetic diversity. Arrows indicate the directional movement of chromosomes, making the sequential flow of meiotic division visually intuitive.
In contrast, the abnormal meiosis section of the illustration highlights chromosome segregation errors, such as nondisjunction, where homologous chromosomes or sister chromatids fail to separate properly. Vector diagrams often depict metaphase misalignment or anaphase failure, with arrows showing both chromosomes moving to the same daughter cell. This results in gametes with missing or extra chromosomes, which can lead to conditions such as Down syndrome (trisomy 21), Turner syndrome (monosomy X), or Klinefelter syndrome (XXY). Labels identify affected chromosomes, while color-coding distinguishes normal versus abnormal segregation, providing a clear visual comparison.
Vector illustrations often include side-by-side comparisons of normal and abnormal outcomes, emphasizing the differences in chromosome number, genetic variation, and potential consequences. For example, normal meiosis produces four haploid gametes with unique combinations, while abnormal meiosis may produce one gamete with an extra chromosome, one missing a chromosome, and others normal or defective. Arrows, dashed lines, and contrasting colors visually highlight these discrepancies, allowing learners to quickly grasp the impact of division errors on reproduction.
Magnified insets are often used to illustrate crossing over, chiasma formation, and recombination in normal meiosis versus misaligned or improperly segregated chromosomes in abnormal meiosis. These details clarify the molecular and structural basis for genetic variation in normal gametes and genetic disorders in abnormal gametes. Labels may include terms such as homologous pair, sister chromatid, centromere, spindle fibers, and gamete outcome, reinforcing both terminology and functional understanding.
Additional features in the vector illustration may include clinical context or consequences of abnormal meiosis. Diagrams may indicate that aneuploid gametes can result in miscarriages, congenital disorders, or reduced fertility, while normal meiosis ensures viable, genetically diverse offspring. Arrows or callouts can connect errors in chromosomal segregation to downstream biological effects, integrating molecular events with organism-level outcomes.
Vector diagrams may also depict meiotic checkpoints, showing where the cell monitors chromosome alignment and attachment to spindle fibers. Highlighting these checkpoints emphasizes the cell’s mechanisms for preventing errors, and contrasting them with abnormal meiosis illustrations shows how checkpoint failures contribute to defective gametes. Color-coded highlights or alert symbols can indicate stages where nondisjunction or missegregation occurs, enhancing visual clarity.
By combining stepwise normal meiosis, abnormal division examples, chromosome coloring, gamete outcomes, and recombination events, a vector illustration provides a comprehensive view of how genetic variation is produced and how errors can lead to abnormalities. The diagram visually conveys the sequential process, structural dynamics of chromosomes, and functional consequences of proper versus improper segregation, making complex genetic concepts accessible and educational.
Ultimately, a vector illustration comparing normal and abnormal meiosis demonstrates the balance between genetic diversity and stability, showing how precise chromosomal division ensures healthy gametes, while errors create genetic disorders. Through labeled stages, color-coded chromosomes, directional arrows, and side-by-side comparisons, the diagram transforms abstract cellular processes into a visually intuitive educational framework, enhancing understanding of meiosis, inheritance, and genetic health.