Equilibrium in Physical Process Vector Illustration Showing Balance Between Forward and Reverse Reactions
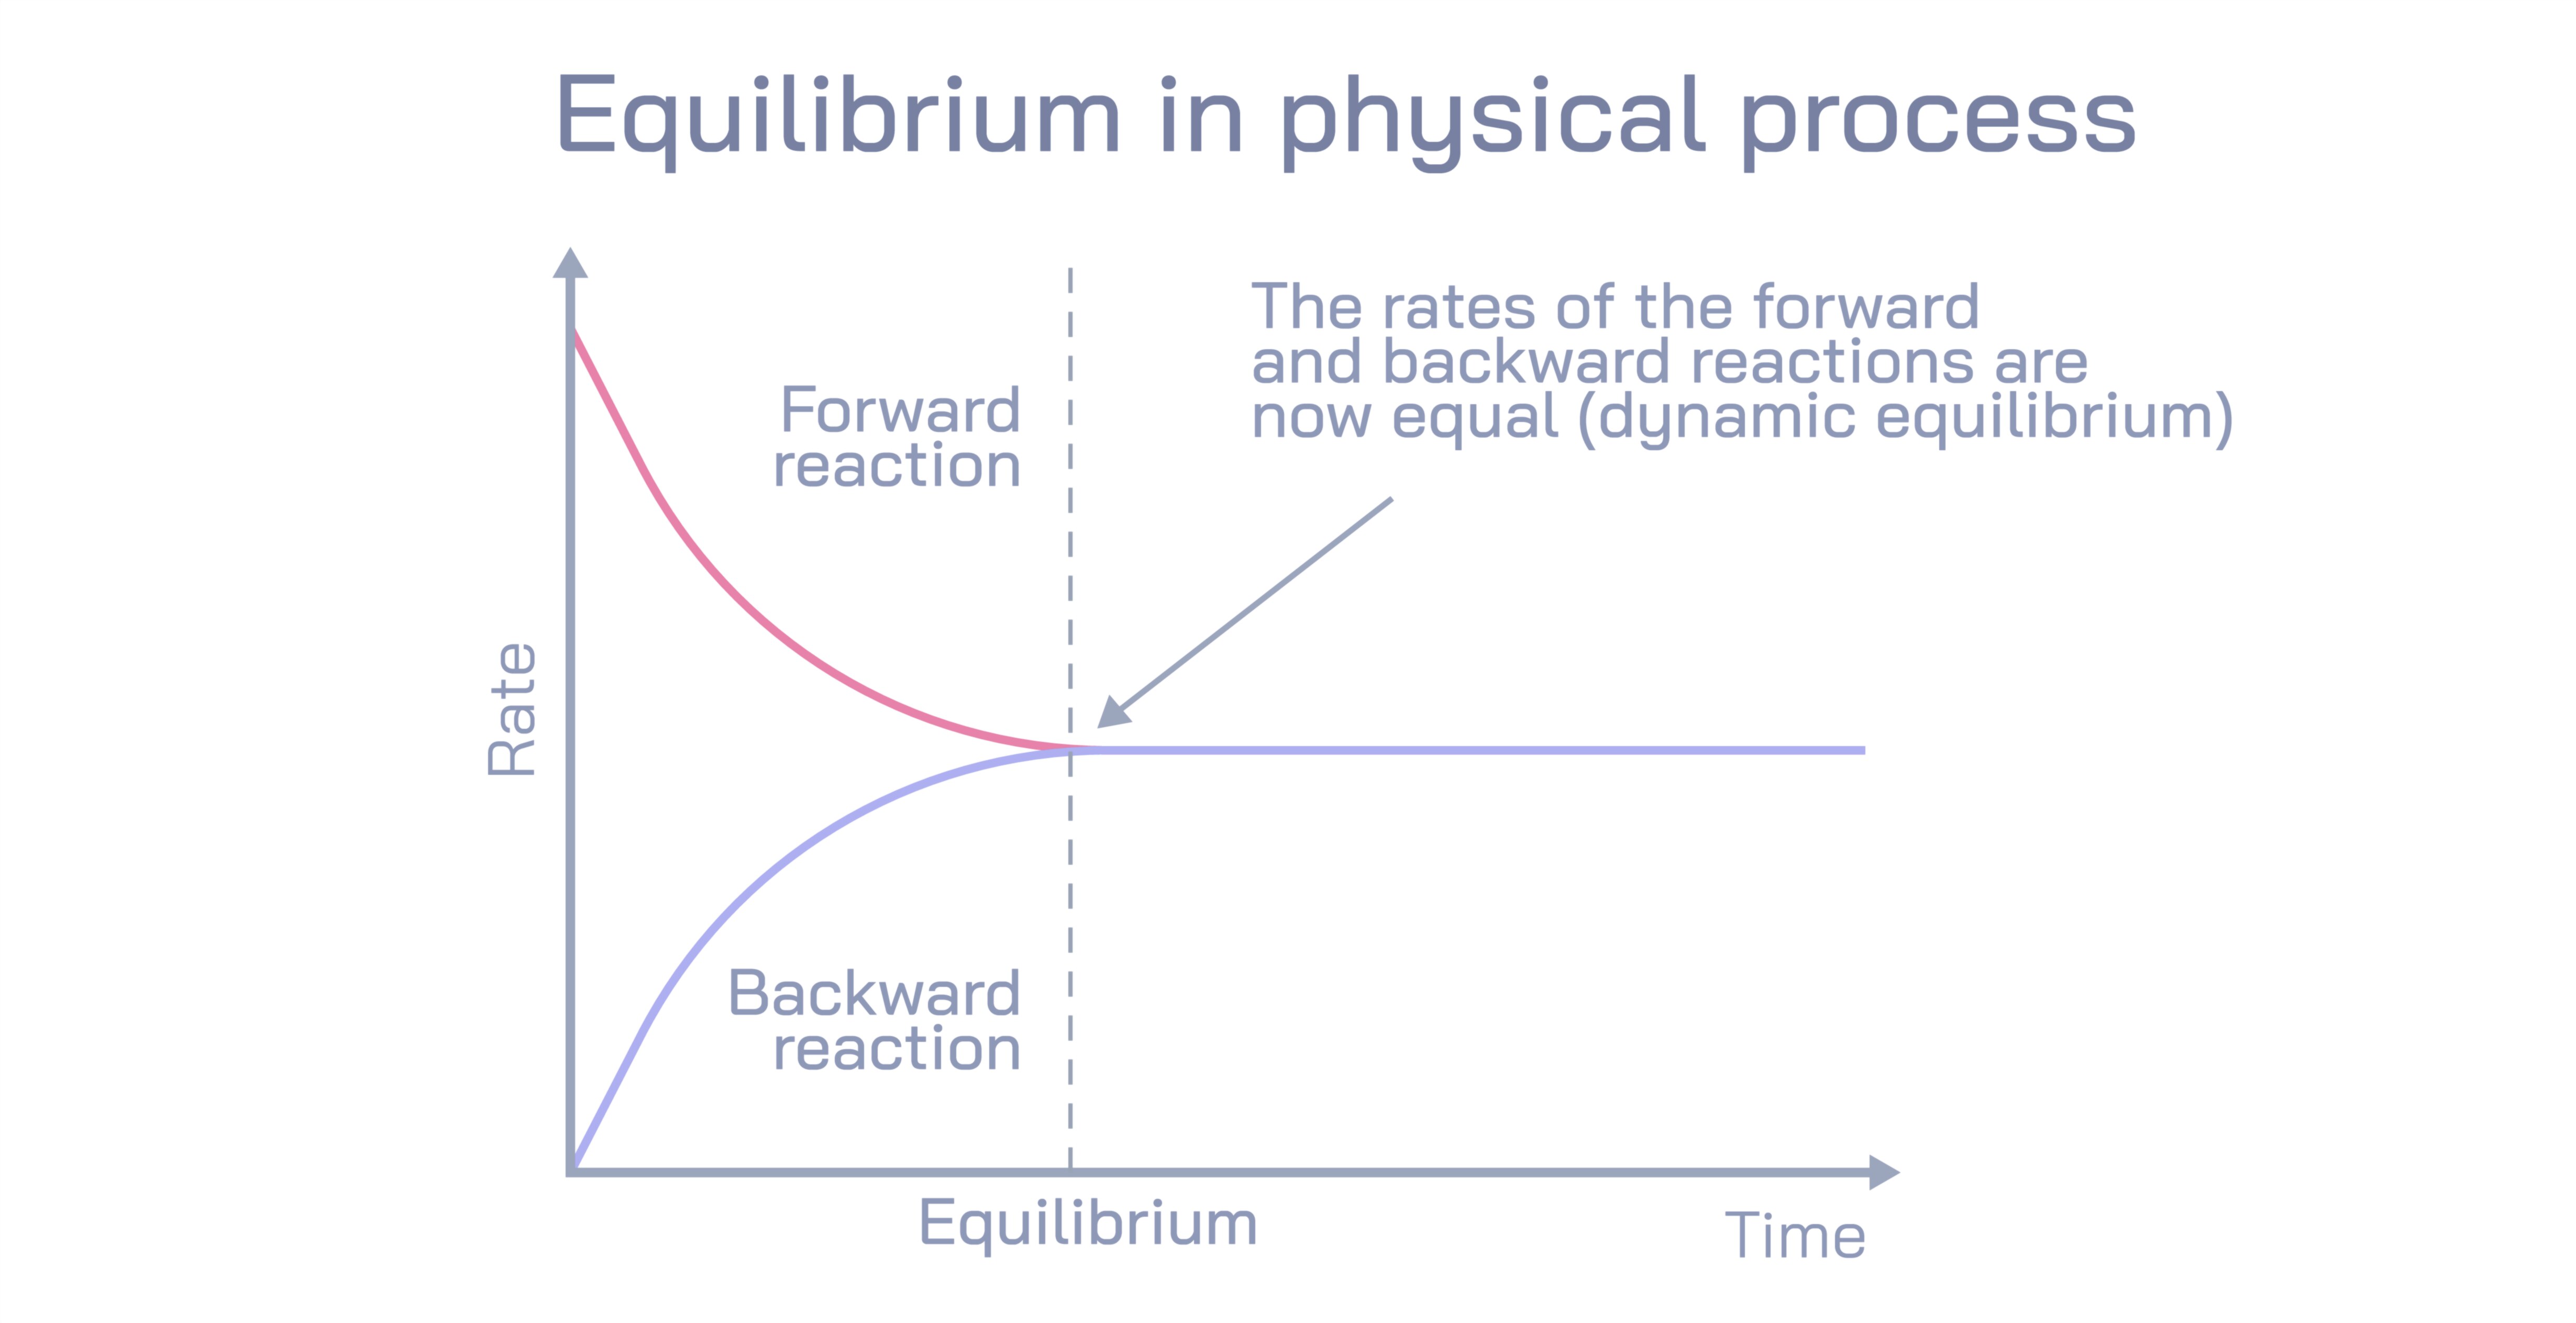
Equilibrium in physical and chemical processes represents a state in which the rate of the forward reaction equals the rate of the reverse reaction, resulting in stable concentrations of reactants and products over time. This concept is fundamental in chemistry, physics, biology, and engineering, as it explains how systems achieve stability under dynamic conditions. A vector illustration of equilibrium typically shows the reactants and products with arrows pointing in both directions, representing the ongoing nature of the reactions, along with markers indicating concentrations, energy levels, or phase transitions. Such diagrams allow viewers to visualize the dynamic balance, emphasizing that equilibrium is not a static condition but a continuous process in which molecules or particles constantly interact while maintaining an overall steady state.
In the context of a chemical reaction, equilibrium occurs in reversible reactions, which can proceed both in the forward and reverse directions. A vector illustration often represents this with a double-headed arrow (⇌) between reactants (A, B) and products (C, D), clearly indicating that molecules are interconverting continuously. In a physical process, such as phase changes, equilibrium can represent the balance between melting and freezing, evaporation and condensation, or sublimation and deposition. For example, at the melting point, the rate at which solid ice melts into liquid water equals the rate at which liquid water freezes into solid ice. The illustration may show molecules transitioning between phases, with arrows of equal length or thickness representing the equality of forward and reverse rates. This visual conveys the essential idea that equilibrium is dynamic rather than static, with microscopic processes ongoing even though macroscopic properties appear constant.
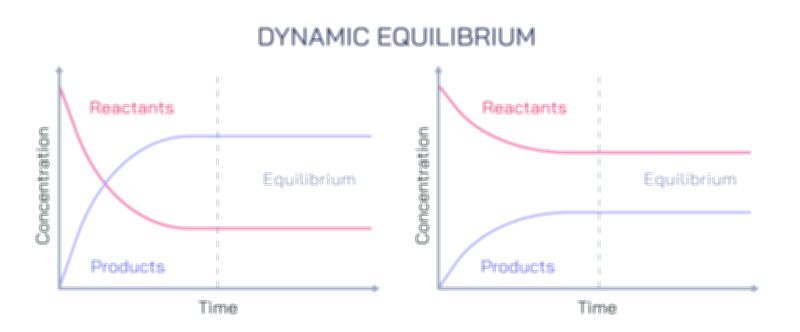
Vector illustrations of equilibrium often incorporate concentration markers or graphs to show that while individual particles continue to react, the overall concentrations of reactants and products remain unchanged. For instance, horizontal bars or circles representing molecules may indicate that the quantity of A and B molecules remains constant over time despite continuous transformation into C and D, which balances the reverse conversion. This is particularly important in chemistry, where understanding equilibrium helps predict reaction outcomes, calculate equilibrium constants (K_eq), and design industrial processes such as the Haber process for ammonia synthesis, where maximizing yield requires manipulation of equilibrium conditions.
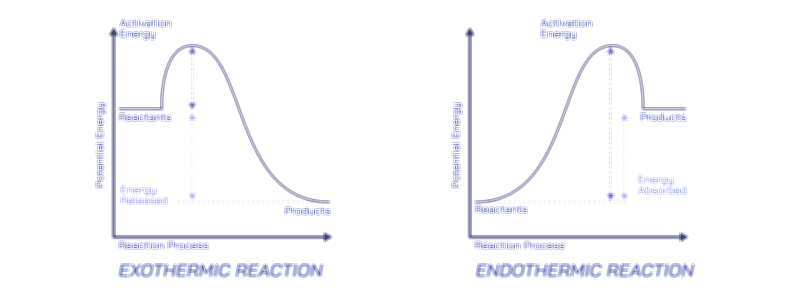
Energy considerations are also frequently included in vector illustrations of equilibrium. A potential energy diagram may be drawn alongside the reaction, showing the activation energy required for the forward and reverse reactions. The forward reaction leads from reactants to products, and the reverse reaction returns products to reactants. At equilibrium, the energy landscape is such that molecules have an equal probability of moving in either direction, with the system’s overall free energy at a minimum for the given conditions. Arrows in the illustration can be color-coded or weighted to represent energy barriers, emphasizing that equilibrium reflects a balance of not just concentrations but also energy flow in the system.
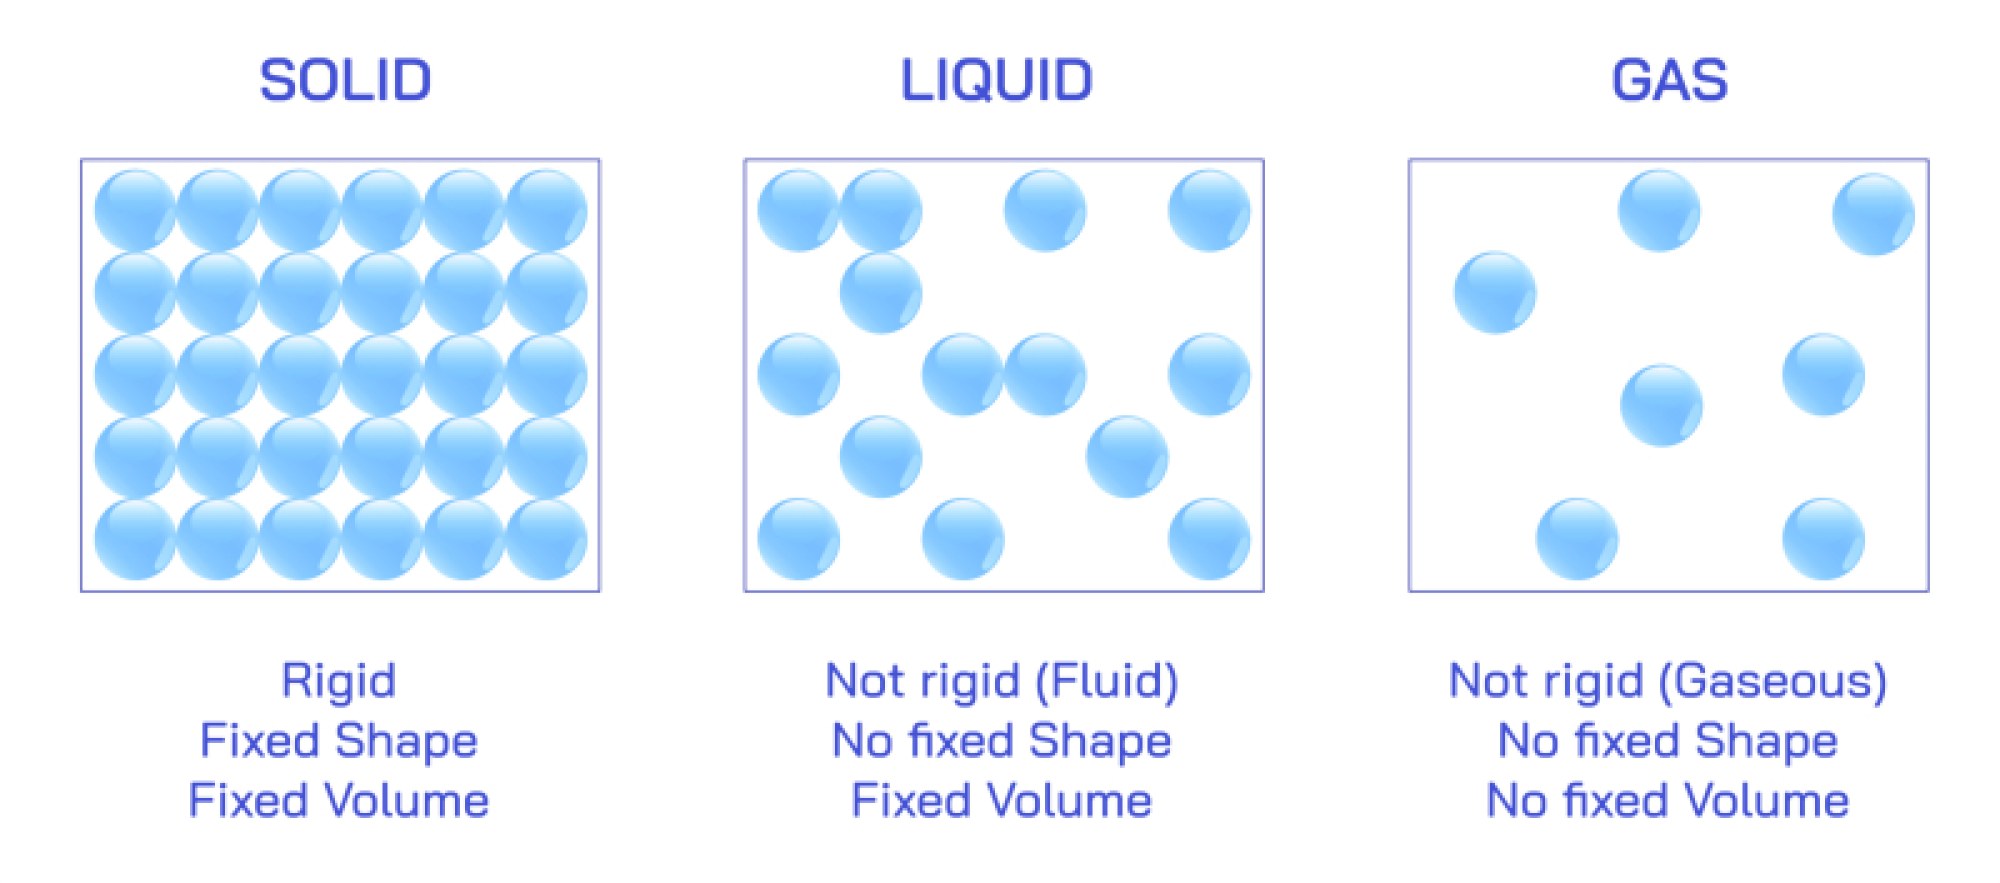
For physical processes, equilibrium illustrations may depict phase transitions. In a diagram of liquid-vapor equilibrium, for example, molecules leaving the liquid phase to become gas are balanced by molecules condensing back into the liquid. Vector arrows can indicate the continuous movement of molecules between phases, while annotations show that the vapor pressure is constant at a given temperature, representing a state of dynamic equilibrium. Similarly, in solid-liquid equilibrium, arrows can show melting and freezing processes occurring at equal rates, emphasizing the stability of macroscopic properties despite ongoing microscopic changes.
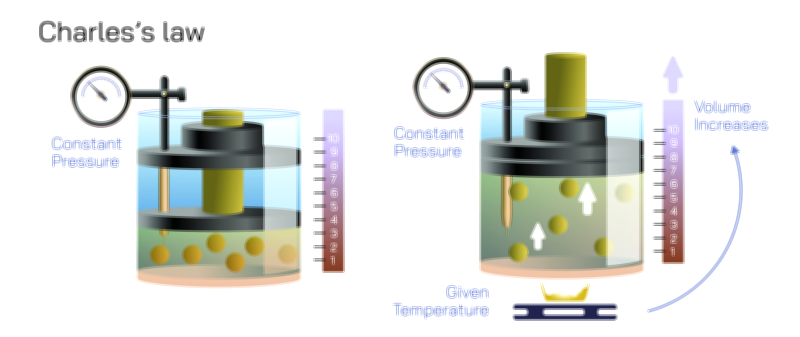
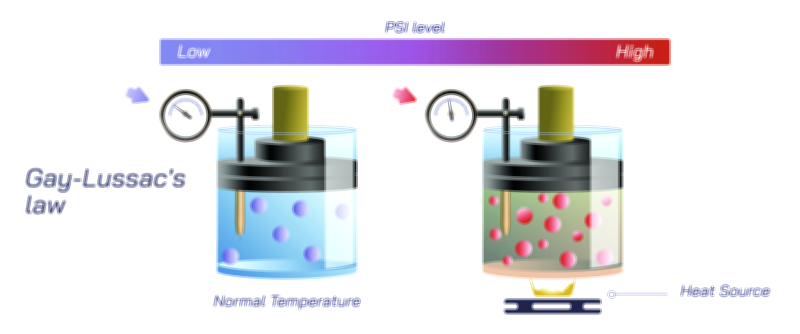
Vector illustrations often highlight the effect of external factors on equilibrium. According to Le Châtelier’s principle in chemical systems, changes in temperature, pressure, or concentration can shift the position of equilibrium to favor either the forward or reverse reaction. For instance, increasing the concentration of reactants may push the system toward forming more products, whereas increasing temperature can favor endothermic reactions. Illustrations may include labeled arrows showing these shifts, helping viewers understand how equilibrium is not a rigid state but a responsive balance that adjusts to environmental conditions while maintaining dynamic stability.
In biological systems, equilibrium is equally important. Enzyme-catalyzed reactions often reach equilibrium, where the rate of substrate conversion to product equals the rate of reverse conversion. Vector diagrams in this context may show molecules entering and leaving the active site of an enzyme at equal rates, reflecting homeostasis at the cellular level. Similarly, gas exchange in the lungs and tissues relies on dynamic equilibrium between oxygen and carbon dioxide partial pressures, which can also be represented visually with bidirectional arrows indicating continuous but balanced movement.
A comprehensive vector illustration of equilibrium includes several key features:
Reactants and products clearly labeled with bidirectional arrows indicating forward and reverse reactions.
Arrows representing rate equality, often of equal length or thickness to show balance.
Molecular representation, with particles shown interconverting continuously.
Energy diagrams, showing activation energies and relative energy levels for forward and reverse reactions.
External factors such as temperature, pressure, or concentration that can shift equilibrium.
Phase transition examples, illustrating physical equilibrium in melting, freezing, evaporation, and condensation.
By integrating molecular dynamics, energy landscapes, and macroscopic balance, the vector illustration conveys the full complexity of equilibrium. It emphasizes that even when a system appears stable, microscopic activity continues unabated, maintaining a delicate balance. This understanding is crucial across scientific disciplines, from chemical engineering to biochemistry, physics, and environmental science.
Ultimately, the vector illustration of equilibrium in physical and chemical processes communicates that equilibrium is a dynamic state of balance, not a cessation of activity. It demonstrates how forward and reverse reactions coexist, how energy barriers and molecular motion govern the process, and how environmental factors can shift the system while maintaining overall stability. By showing these relationships visually, the diagram provides a comprehensive and intuitive understanding of equilibrium, bridging microscopic molecular interactions with macroscopic observations and real-world applications, allowing learners to grasp the fundamental principles governing dynamic stability in nature.