Earthquake and Tectonic Plate Movement Illustration: Causes and Fault Zones Explained
Earthquakes are among the most powerful and dramatic natural events on Earth, and an illustration that shows tectonic plate movement and fault zones allows the complex internal forces of the planet to become visually understandable. Deep beneath the surface, the Earth is not a single unbroken sphere but a mosaic of rigid pieces called tectonic plates that float atop the underlying semi-fluid asthenosphere. These plates are constantly in motion—slowly but relentlessly—driven by heat energy from Earth’s interior and the circulation of mantle material. Although their speed is extremely slow in human terms, typically a few centimeters per year, the accumulated stress when plates press, pull, or slide past each other builds forces large enough to reshape landscapes, raise mountain chains, form ocean basins, and trigger earthquakes. When geological diagrams show these plates as interlocking puzzle pieces atop a slowly convecting mantle, the source of earthquake activity becomes clearer: the planet’s surface is not still but dynamic, and earthquakes are the surface expression of forces generated by deeper planetary motion.
A tectonic plate illustration typically highlights three primary boundary types where earthquakes are most common: convergent boundaries, divergent boundaries, and transform boundaries. At convergent boundaries, plates move toward one another and collide. If both plates carry continental crust, the collision forces landmasses upward, creating towering mountain systems such as the Himalayas. If one plate is oceanic and the other continental, the denser oceanic plate sinks beneath the lighter continental plate in a process called subduction. An illustration of this mechanism shows the oceanic slab descending into the mantle, dragging sediments and water downward and generating intense pressure and heat. These subduction zones are among the most earthquake-prone regions on Earth because the descending plate does not glide smoothly; instead, it locks, builds stress, and then suddenly slips, producing deep and powerful earthquakes. Many of the world’s most destructive quakes have occurred along subduction boundaries, and volcanic arcs often emerge nearby as melting mantle rises to the surface.
Divergent boundaries appear very differently in illustrations. Here, plates move apart rather than collide. In the ocean basins, a divergent boundary creates mid-ocean ridges—vast underwater mountain belts formed by rising magma that cools into new crust. While these earthquakes are frequent, they are often less destructive because most occur deep underwater and involve tension rather than powerful compression. On land, divergent boundaries create rift valleys, where the lithosphere stretches and fractures into blocks that sink or tilt. Illustrations of rifting show crust cracking repeatedly, creating elongated valleys that may eventually widen enough to form new ocean basins. Earthquakes here are associated with the movement of magma and the fracturing of crust as it stretches, and although they can impact nearby populations, they tend to be shallower and more localized than those of convergent subduction zones.
Transform boundaries complete the tectonic earthquake picture by showing plates sliding horizontally past each other. At these boundaries, crust does not merge or pull apart—it grinds. Because friction prevents smooth movement, plates along transform faults stick for long periods and then suddenly rupture in bursts of violent slipping. Diagrams of transform boundaries highlight offset landforms and linear fault features that run across landscapes like geological scars. The San Andreas Fault in California is a classic example of a continental transform boundary, and illustrations often depict the opposing motion of the Pacific Plate sliding northwest alongside the North American Plate. Earthquakes here can be very shallow but extremely damaging because the rupture occurs close to the surface, releasing energy directly into populated regions. Unlike convergent zones, transform boundaries rarely produce volcanic activity, making earthquakes their most prominent geologic expression.
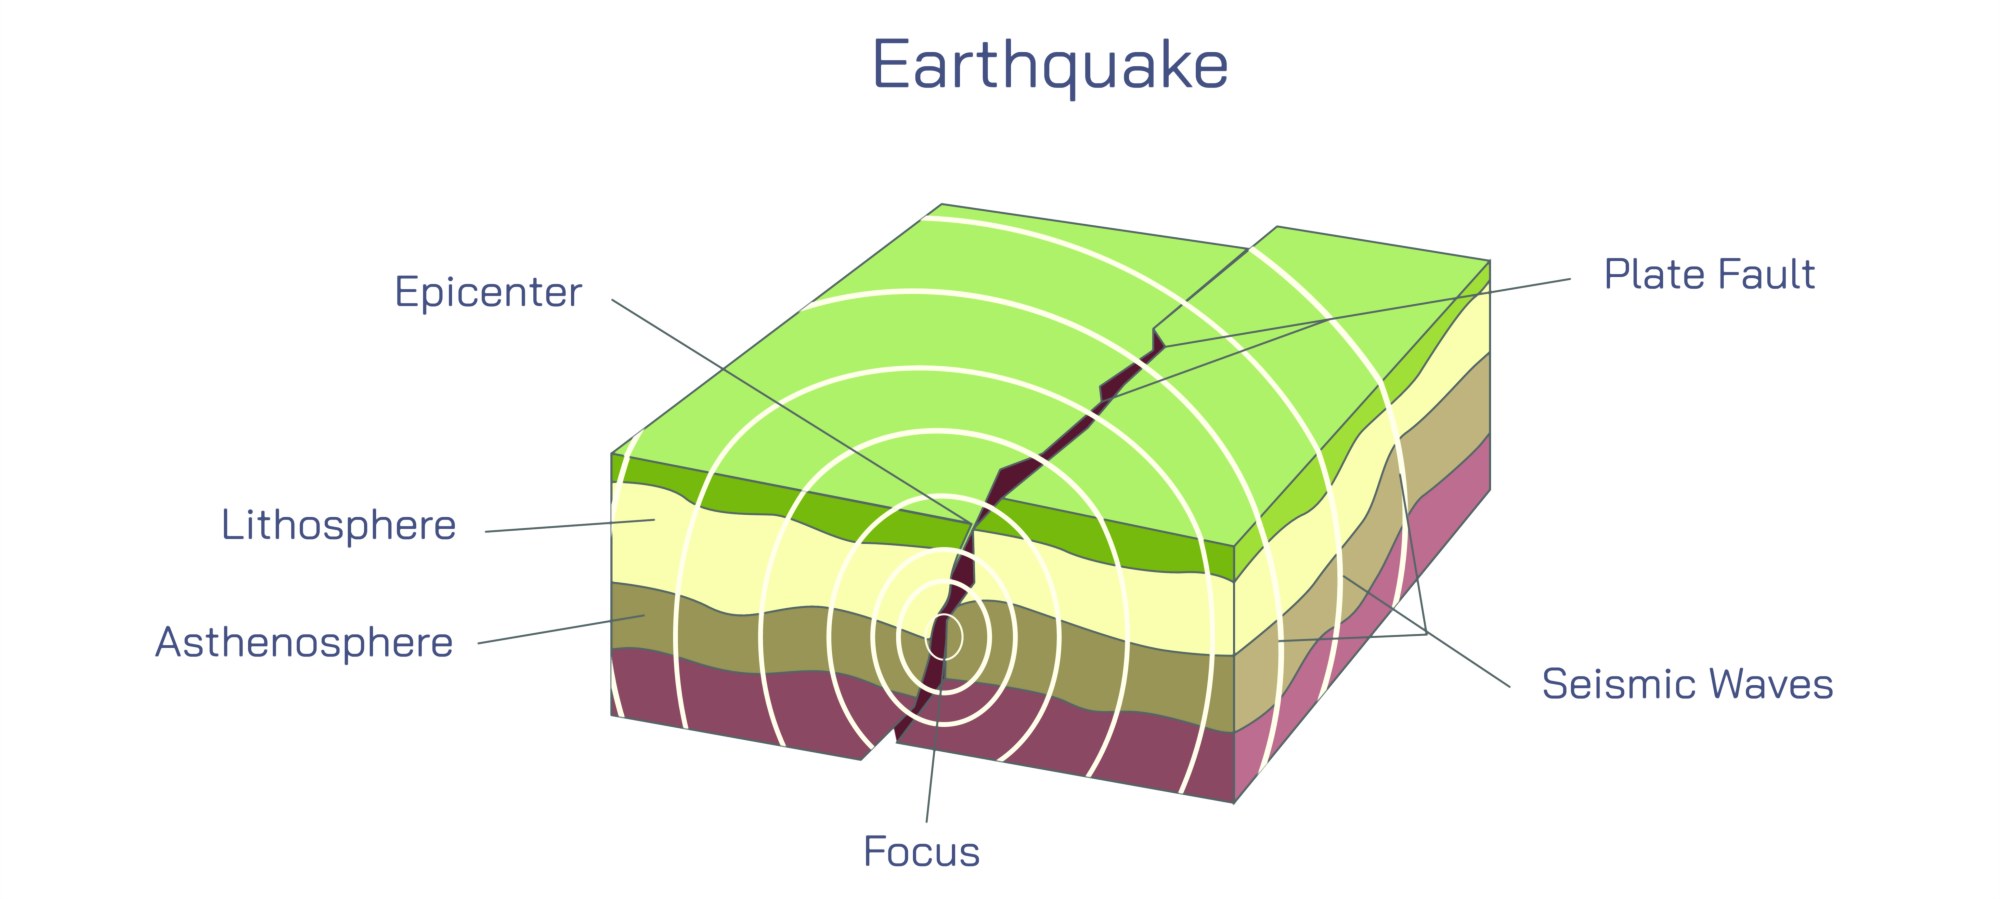
To understand how tectonic motion generates earthquakes, illustrations often zoom in from the large-scale view of plate interactions to the localized region of stress called a fault zone. A fault is a fracture or system of fractures in Earth’s crust along which rocks have moved. Not all faults lie at plate boundaries, but most major seismic activity originates from faults influenced by plate forces. The buildup of energy occurs because rocks on opposite sides of a fault are held together by friction. As plate motion continues, stresses accumulate silently over years, centuries, or even longer. Once the stress exceeds the strength of the rock and the frictional resistance, the fault ruptures and slips suddenly. In a fault illustration, this rupture propagates along the fault surface while stored elastic energy is released in the form of seismic waves. These waves travel outward from the rupture point, known as the focus, and project upward to a surface point called the epicenter, which becomes the reference point for earthquake location.
Illustrations also differentiate between the main types of fault movements: normal faults, reverse (or thrust) faults, and strike-slip faults. Normal faults occur in regions where the crust is being pulled apart, and the diagram shows one block sliding downward relative to the other under tension. Reverse and thrust faults appear in compressional environments, where one block is forced upward over the other during collision. These are common in convergent margins and are responsible for many large earthquakes in mountainous regions. Strike-slip faults dominate transform boundaries, where movement occurs horizontally rather than vertically. In this type of fault diagram, arrows on each side of the fracture show opposite lateral motion, illustrating the shearing interaction that builds up strain until the eventual slip.
Seismic wave illustrations bring the invisible shaking of the Earth to light. When the fault ruptures, two main types of waves travel through the ground: body waves, which move through Earth's interior, and surface waves, which travel along the outer crust. Body waves are further divided into P-waves, which push and pull rock particles in the direction of motion like a compression spring, and S-waves, which move particles perpendicular to their direction of travel like a whipping rope. P-waves travel the fastest and are the first to reach distant seismometers, followed by S-waves. Surface waves arrive last but cause the greatest shaking and damage because they ripple and roll through the upper crust where buildings and people are located. In a seismic wave illustration, ground surfaces appear oscillating, rolling, or twisting depending on the type and sequence of waves, demonstrating why earthquakes feel complex and not like a single jolt.
Earthquake energy is also shown in diagrams that include the elastic rebound theory, which helps explain the sudden release of strain. As stress accumulates, rocks bend and deform elastically like compressed springs. When the rupture occurs, they snap back to a less strained position, releasing the stored energy. A sequence of compress-deform-rupture-reset frames visually clarifies this cycle and develops an intuitive understanding of why earthquakes strike without warning despite long periods of quiescence.
Earthquake illustrations often expand further to explore secondary effects that follow tectonic motion. In subduction zones, underwater earthquakes can suddenly displace large volumes of seawater, generating tsunamis. A tsunami illustration shows uplift or subsidence of the seafloor pushing the ocean outward and forming long, powerful waves that travel across entire ocean basins. Landslides triggered by shaking are depicted in mountainous regions where unstable slopes collapse. Soil liquefaction diagrams show how water-saturated sediments lose strength under shaking, causing buildings and roads to sink or tilt dramatically. These secondary hazards underline that the consequences of tectonic plate motion extend far beyond the initial rupture.
Modern earthquake hazard maps are another common visual tool associated with tectonic plate movement. When plate boundaries and known fault systems are overlaid on a global map, earthquake locations appear as dense clusters tracing the edges of plates. The “Ring of Fire” encircling the Pacific Ocean region stands out prominently, with deep and shallow earthquakes outlining subduction zones in Japan, Indonesia, Chile, Alaska, and numerous Pacific islands. Regions like the Mediterranean, Himalayan belt, East African Rift, and Mid-Atlantic Ridge also show concentrated seismicity, reinforcing that earthquakes do not occur randomly but follow the architecture of plate tectonics.
Ultimately, an illustration depicting earthquakes and tectonic plate movement does more than explain geological mechanics—it reveals the deep, ongoing forces that continually shape Earth’s surface. It shows how continents drift, mountains rise, ocean basins form, and stress accumulates slowly until suddenly released in dramatic geological events. It explains why some regions of the world are relatively quiet while others face persistent seismic risk, and why preparedness, monitoring, and structural resilience are crucial for communities living near active fault zones. By turning invisible internal processes into visual understanding, an earthquake and tectonic plate movement illustration connects human experience at the surface to the massive internal engines of the planet—engines that have been constructing and reshaping Earth for billions of years and continue to do so in every tremor, shock, and shifting crack of the ground beneath our feet.