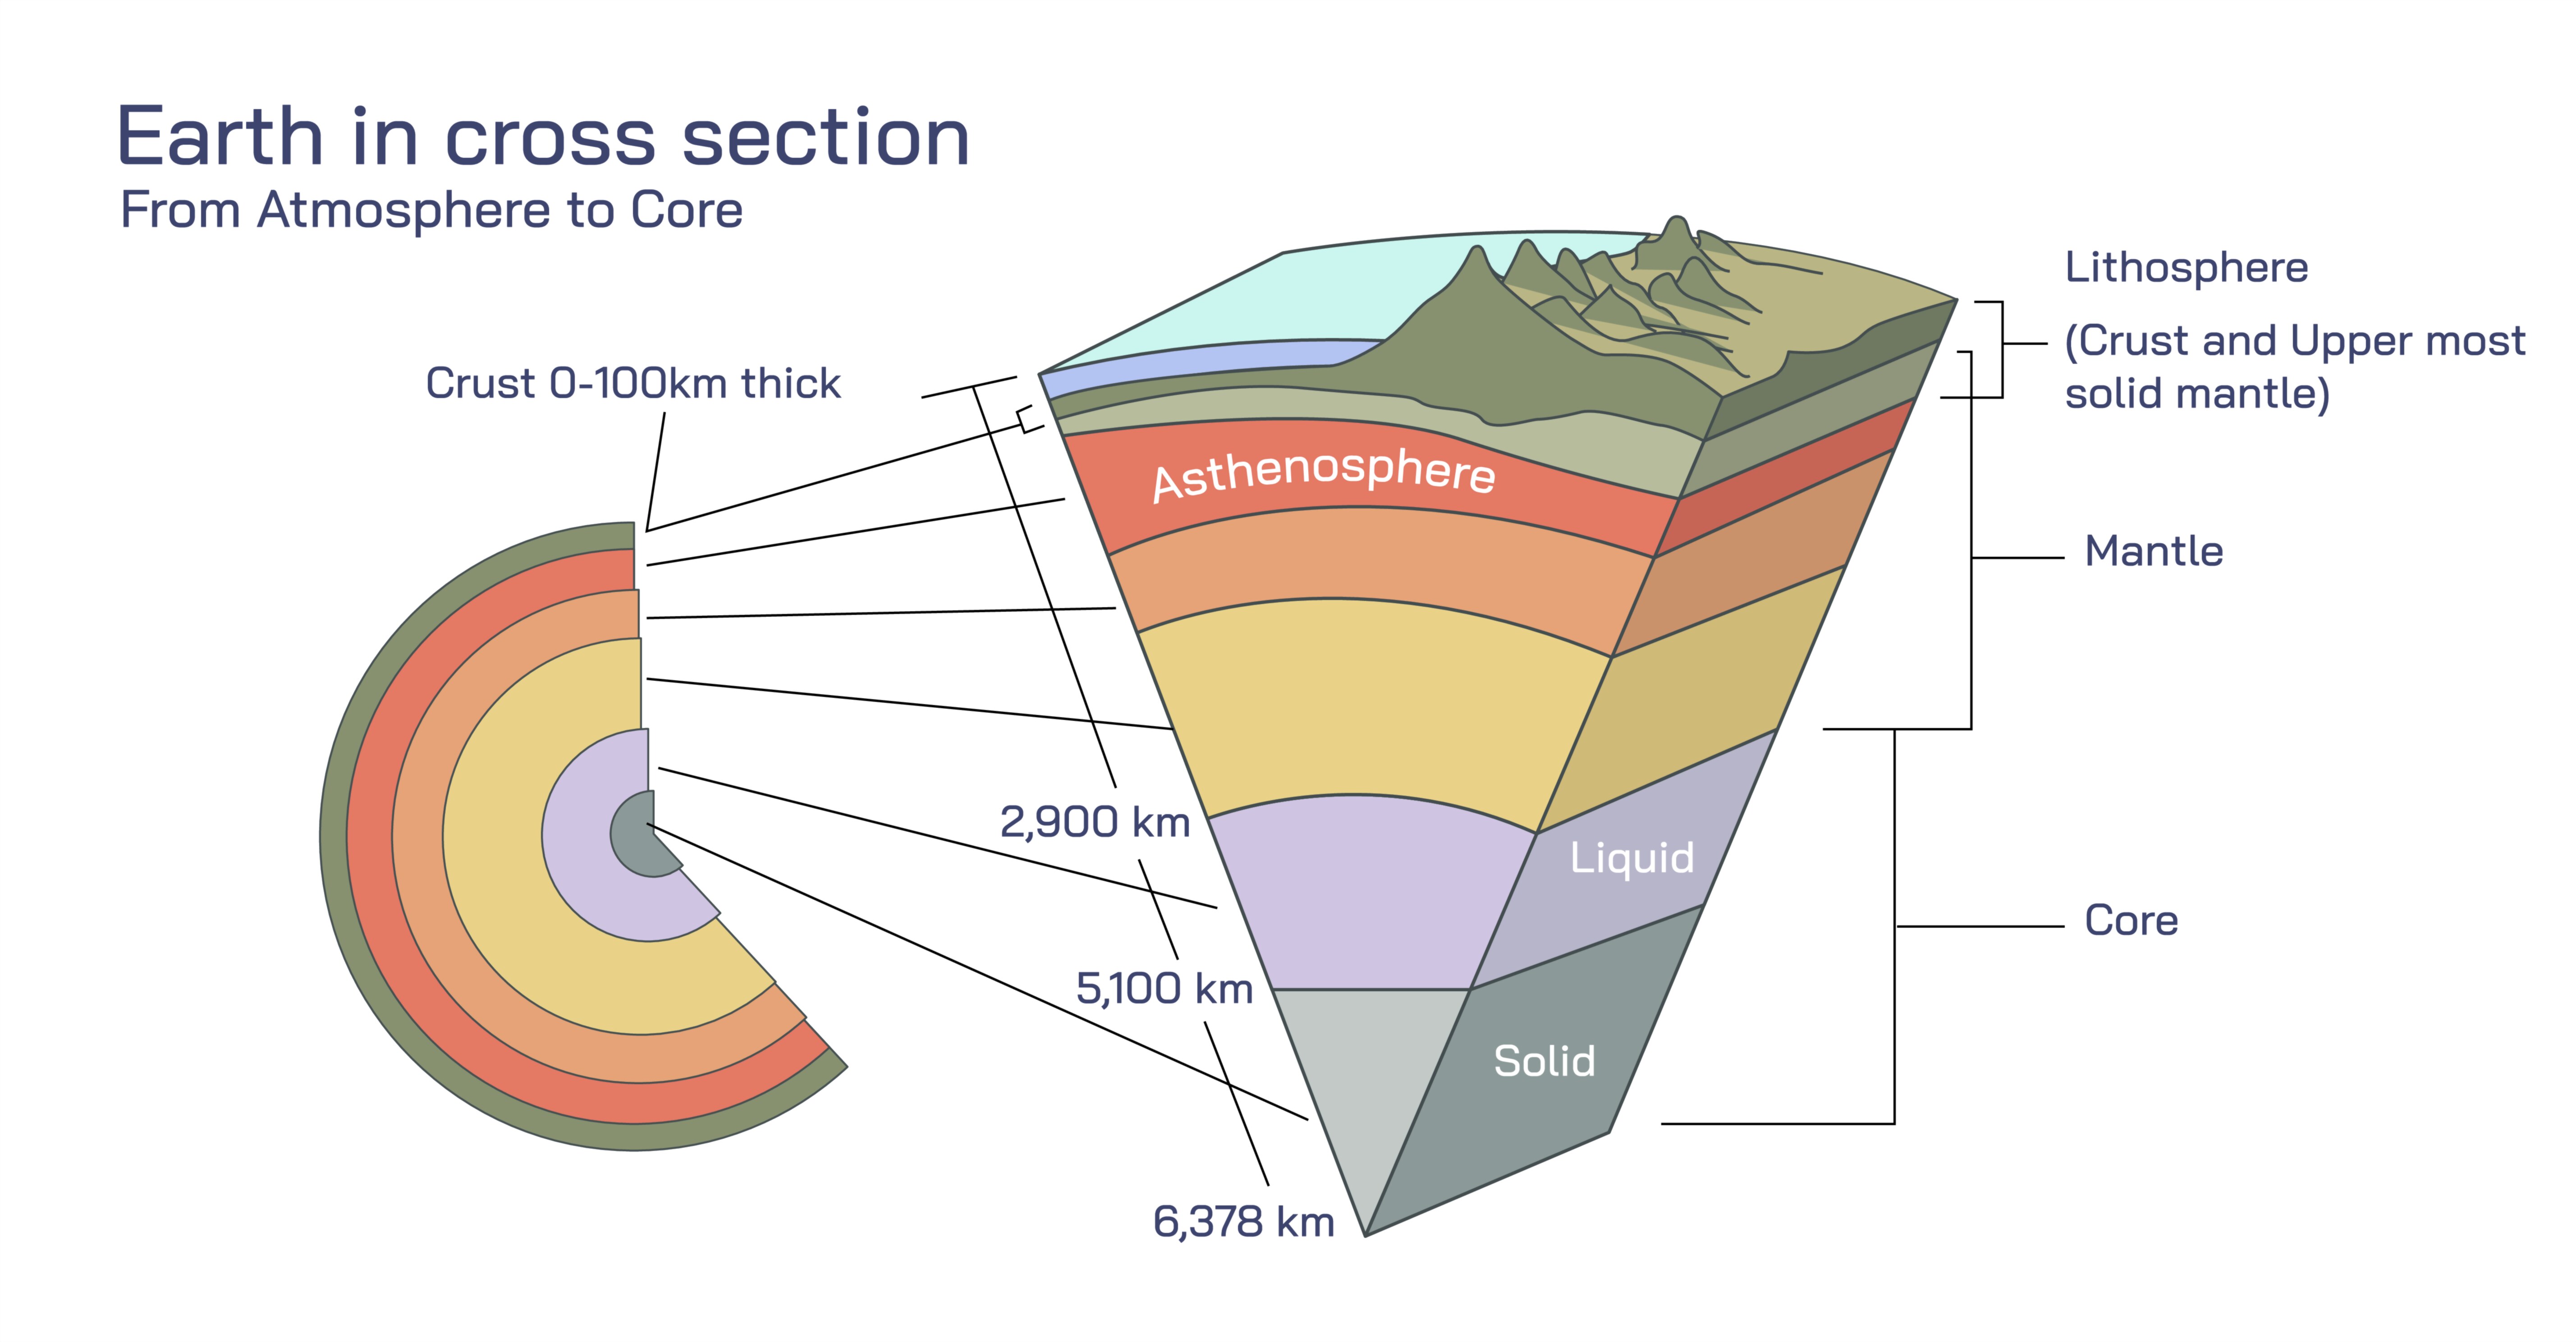
Earth in Cross Section Vector Illustration Showing Crust, Mantle, Outer Core, and Inner Core Layers
The Earth is a complex, multilayered planet whose internal structure plays a critical role in shaping geological processes, influencing magnetic fields, and regulating thermal energy. Understanding the Earth’s layers is essential in geophysics, geology, seismology, and planetary science, and vector illustrations showing the Earth in cross section provide a visually compelling way to communicate these concepts. A detailed illustration typically includes the crust, mantle, outer core, and inner core, emphasizing differences in thickness, composition, density, and physical state. Such diagrams allow learners and professionals to comprehend not only the stratification of the planet but also the dynamic interactions between layers that drive phenomena like plate tectonics, earthquakes, volcanism, and the generation of the geomagnetic field. By visualizing these layers together in a single cross-sectional representation, one can understand the Earth as both a static structural entity and a dynamic system capable of change over geological timescales.
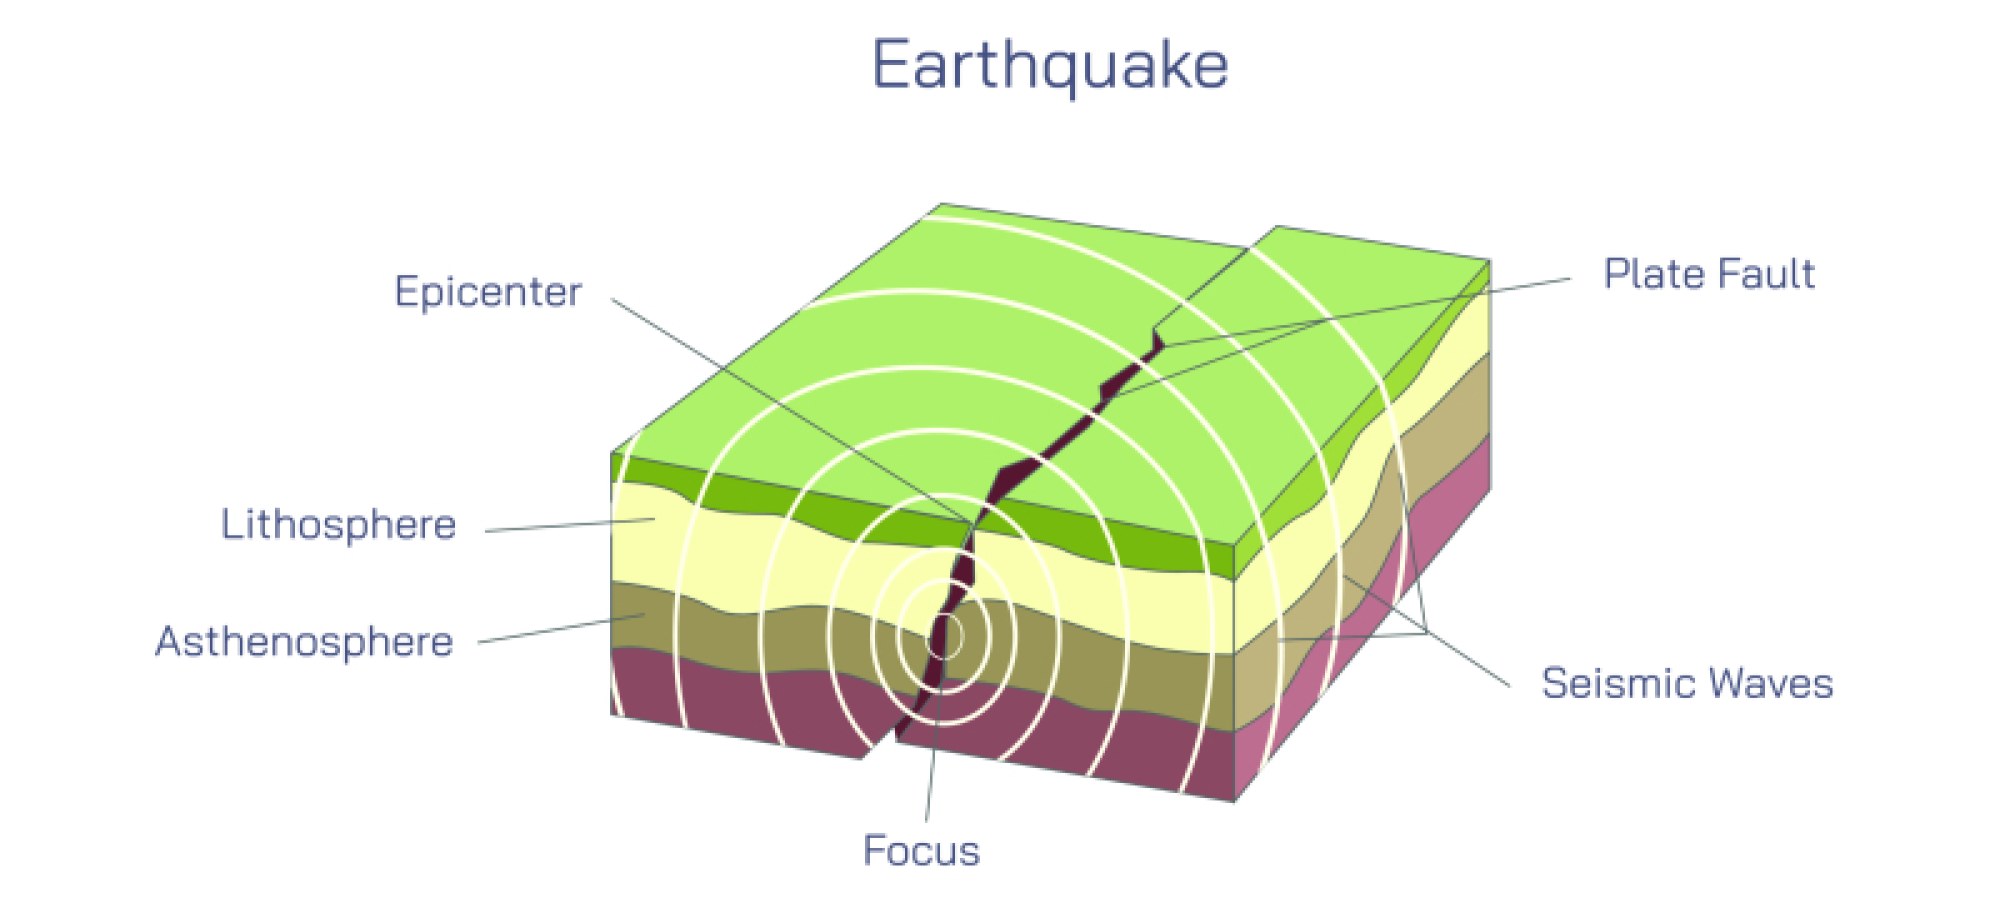
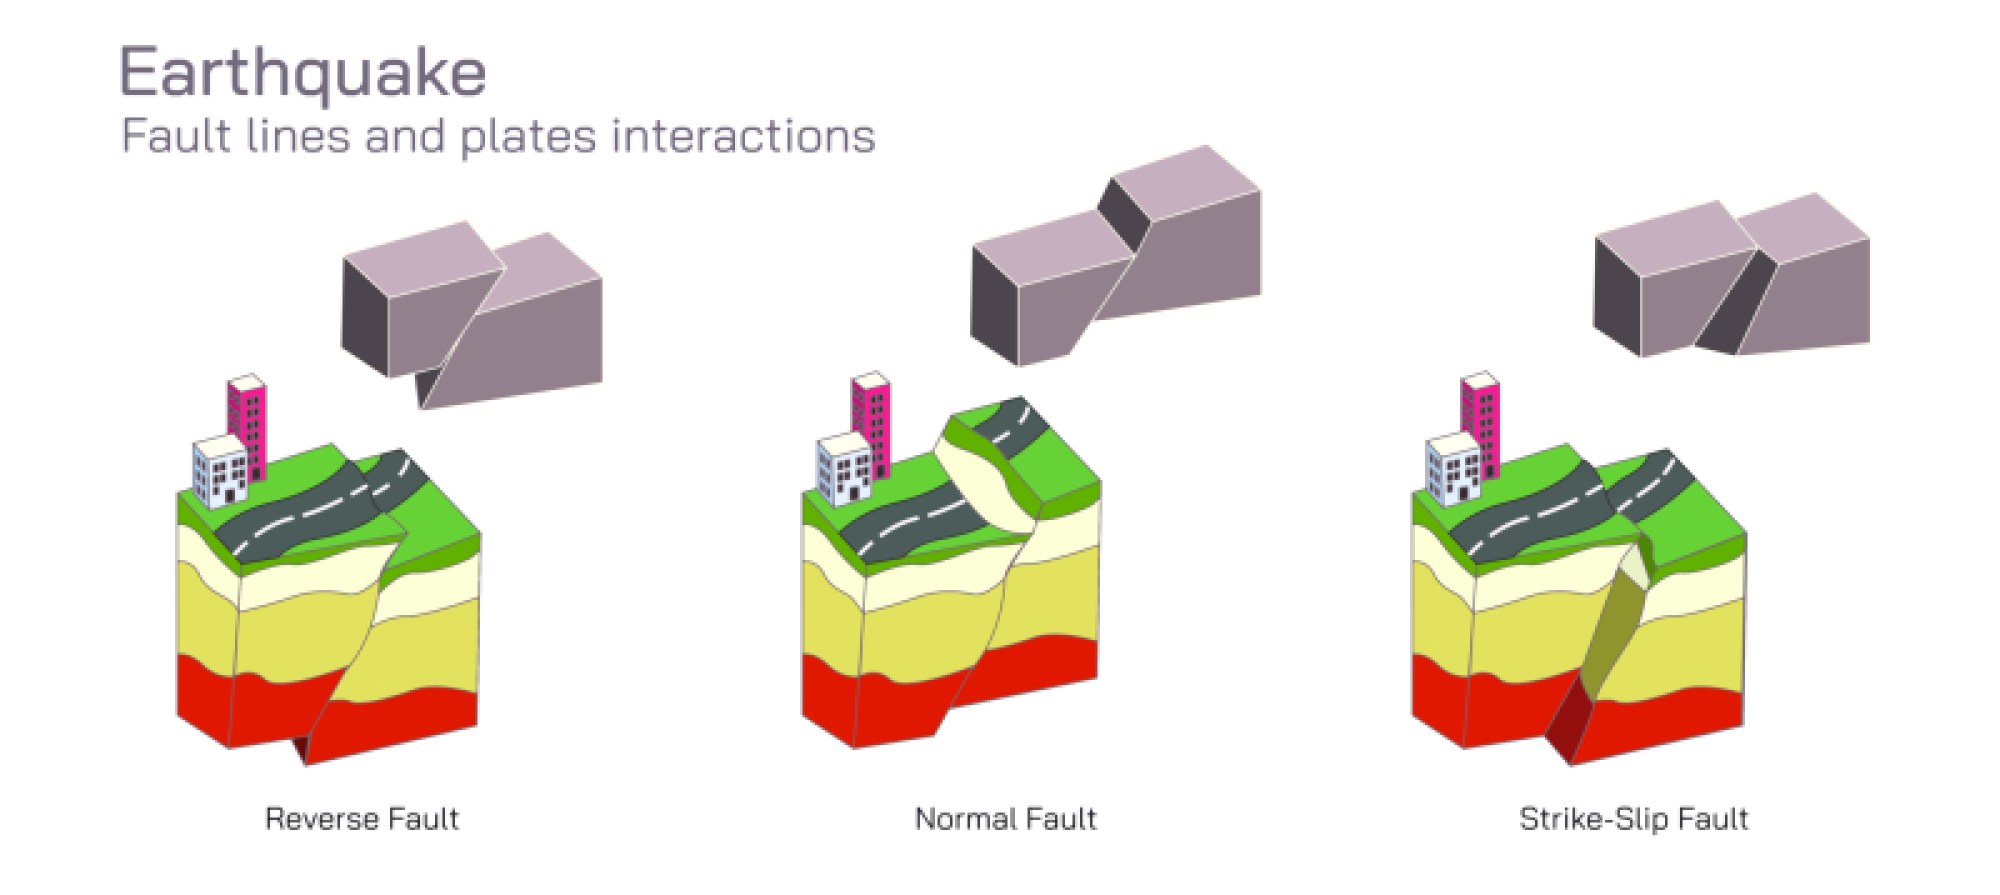
The crust represents the Earth’s outermost layer, forming the solid interface between the planet’s interior and the atmosphere. Though it is the thinnest of all layers, its relative accessibility and direct interaction with surface processes make it extremely important. The crust varies in thickness, measuring only a few kilometers beneath ocean basins and ranging from 30 to 70 kilometers under continental masses. Compositionally, the crust consists primarily of silicate rocks, with granite dominating continental crust and basalt constituting oceanic crust. In vector illustrations, the crust is often represented as a narrow outer ring or shell, with annotations to indicate differences between continental and oceanic regions. The crust is rigid and brittle, yet it is fractured into tectonic plates. These plates, floating atop the more ductile mantle, interact at plate boundaries, giving rise to earthquakes, mountain formation, subduction zones, and rift valleys. To enhance understanding in a diagram, surface features such as mountain ranges, ocean trenches, volcanoes, and continental shapes may be overlaid on the crust, connecting abstract structural concepts to tangible geographical phenomena.
Beneath the crust lies the mantle, the thickest layer of the Earth, extending from the base of the crust down to approximately 2,900 kilometers. The mantle is composed of silicate minerals rich in magnesium and iron, making it denser than the crust. While the mantle is solid, it exhibits plasticity over long periods, allowing slow but persistent convective flow. This property is critical in driving plate tectonics, as rising and sinking mantle material exerts forces on the overlying crustal plates, causing movement that shapes continents and ocean basins. In vector illustrations, the mantle is depicted as a broad, continuous layer with gradient colors or directional arrows to indicate convection currents, illustrating the dynamic flow of material. These currents not only influence tectonic activity but also facilitate the transfer of heat from the deeper interior to the surface. The upper mantle, including the asthenosphere, is particularly significant because it is partially molten, enabling lithospheric plates to move. In addition, some diagrams may indicate mineralogical changes within the mantle, such as the transition from olivine to wadsleyite and ringwoodite at specific depths, highlighting how pressure and temperature alter the physical properties of mantle material.
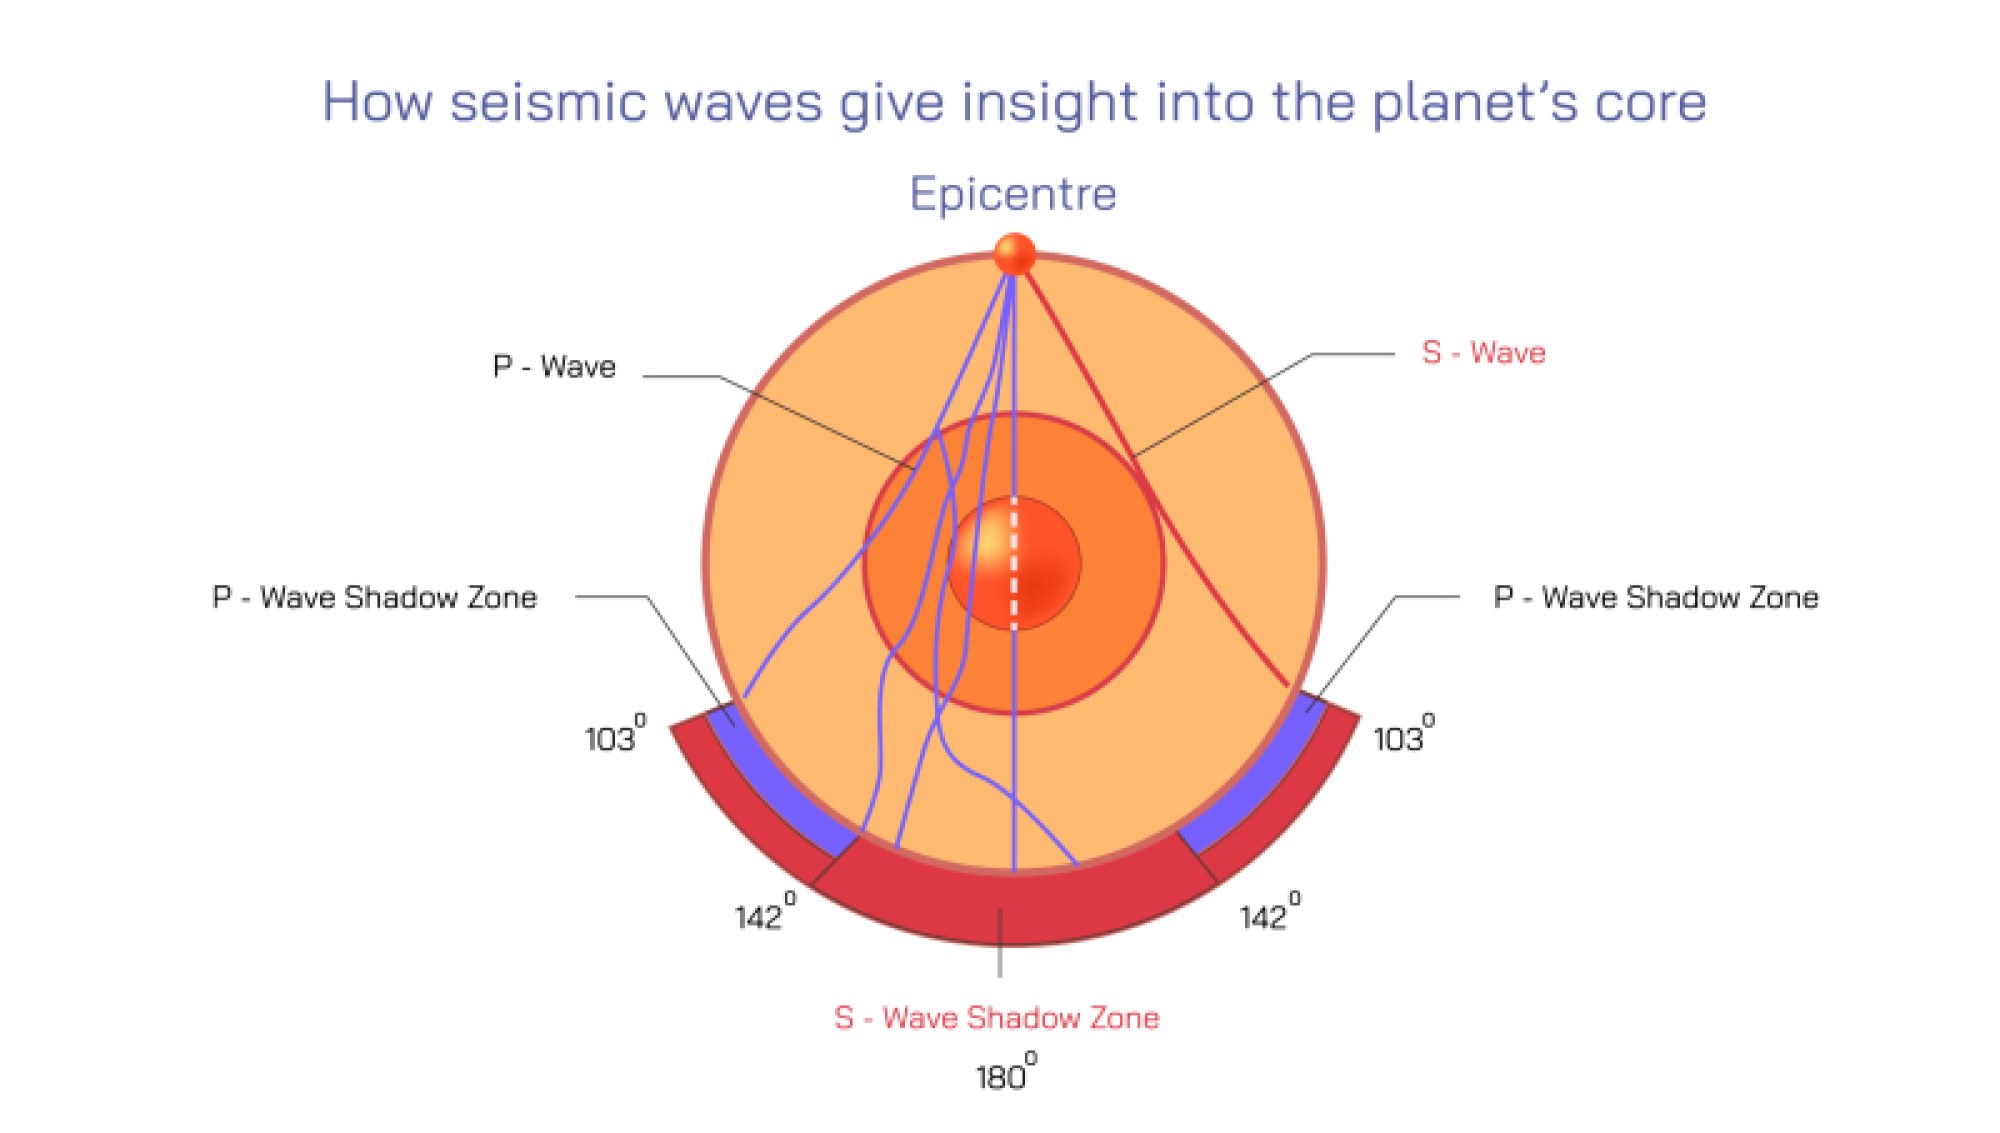
Beneath the mantle lies the outer core, a liquid layer extending from approximately 2,900 kilometers to 5,150 kilometers beneath the surface. Composed mainly of iron and nickel, the outer core is distinguished by its fluid state, which allows it to move and convect. Vector illustrations often depict this layer as swirling or flowing, emphasizing the dynamo effect, the process by which the movement of electrically conductive fluid generates the Earth’s magnetic field. The outer core’s motion is driven by thermal and compositional convection, as the inner core solidifies and releases latent heat, creating currents within the liquid metal. Seismically, the outer core is identified as liquid because S-waves (shear waves) cannot travel through it, while P-waves (compressional waves) do, providing geophysicists with insights into its physical state and properties. In addition to magnetic field generation, the outer core’s dynamic behavior affects the planet’s rotation slightly, contributing to phenomena like polar wander and variations in the length of the day. The outer core is therefore not a static shell but a crucial dynamic system that regulates both internal energy distribution and geomagnetic stability.
At the very center of the Earth lies the inner core, a solid, dense sphere primarily composed of iron and nickel, with a radius of roughly 1,220 kilometers. Despite extreme temperatures ranging from 5,000 to 6,000 degrees Celsius, the immense pressure at the center of the Earth keeps the inner core solid. Vector illustrations typically depict the inner core as the central circle of the cross section, often highlighted with a distinct color to denote its density and solidity compared to the outer core. The inner core grows slowly over geological timescales as the Earth cools, a process that contributes to the convection of the outer core and the continued generation of the geomagnetic field. Some advanced illustrations may indicate differential rotation of the inner core relative to the mantle and outer core, which influences geomagnetic patterns observed at the Earth’s surface. The inner core’s solidification also releases light elements into the outer core, sustaining the convective processes critical for maintaining the geodynamo.
A comprehensive cross-sectional vector illustration often incorporates additional educational details to enhance understanding of the Earth’s interior. These may include:
Tectonic plates on the crust to show interactions at plate boundaries, such as collision zones and subduction regions.
Temperature and pressure gradients across layers to indicate increasing thermal energy and density with depth.
Seismic wave paths, highlighting how P-waves and S-waves travel differently through solid and liquid layers, providing insight into the physical state of each layer.
Convection currents in the mantle and outer core, illustrating the movement of material and the transfer of heat.
Composition annotations, identifying major elements and minerals in each layer, such as silicates in the crust and mantle and iron-nickel alloys in the core.
This layered visualization emphasizes the contrast between the rigid crust, plastically flowing mantle, convective liquid outer core, and solid inner core. Each layer plays a distinct role in the Earth’s overall function: the crust supports life and surface features, the mantle drives plate tectonics and volcanic activity, the outer core generates the magnetic field, and the inner core sustains the convective motion of the outer core while providing a dense, solid center.
The vector illustration also often integrates relative scale, showing the proportion of each layer in relation to the total radius of the Earth. While the crust is extremely thin compared to the mantle and core, it is critically important as the interface for tectonic activity, erosion, and biological processes. The mantle occupies the majority of the Earth’s volume, highlighting its central role in heat transfer and material circulation. The outer core represents a substantial portion of the inner Earth, emphasizing the scale and energy involved in fluid convection, while the inner core, though smallest in volume, is the densest layer and central to the planet’s long-term geodynamic stability.
By combining color coding, labels, arrows, and proportional representation, the cross-sectional vector illustration makes the Earth’s interior accessible and understandable. It provides a visual framework for students, educators, geologists, and engineers to comprehend how structural composition, physical state, and dynamic processes interact in the planet’s interior. From earthquakes and volcanism to the creation of the magnetic field and the thermal evolution of the planet, each layer contributes to the functioning of the Earth as a complex, integrated system.
Ultimately, a well-designed vector illustration of the Earth in cross section communicates both static structure and dynamic processes. The crust, mantle, outer core, and inner core are not isolated layers but interconnected components whose interactions dictate surface phenomena, internal heat flow, geomagnetic behavior, and long-term planetary evolution. By visualizing these layers with clarity, accuracy, and scale, the diagram transforms abstract scientific concepts into tangible knowledge, allowing learners to explore the hidden world beneath their feet and appreciate the intricate architecture of our planet.
This type of illustration is indispensable in geoscience education because it bridges the gap between microscopic mineral properties, large-scale tectonic movements, and global geodynamic phenomena. It provides a framework for understanding seismic activity, volcanic eruptions, geomagnetic field variations, and thermal convection. It highlights the contrast between rigid and ductile layers, between solid and liquid phases, and between surface processes and deep-Earth dynamics. Through proportional coloring, labeling, and detailed annotation, the vector cross-sectional illustration turns the invisible interior of the Earth into a vivid, comprehensive educational tool, offering both clarity and depth for anyone seeking to understand the planet’s inner workings.