Blood Pressure Ranges — Normal, Low, and High Blood Pressure Chart Explained for Medical and Educational Understanding
Blood pressure ranges are among the most widely used and important indicators of human health because they reflect how forcefully circulating blood presses against the walls of arteries, revealing the workload of the heart, the condition of blood vessels, and the efficiency with which oxygen and nutrients are transported throughout the body. When this information is presented visually in a vector illustration, the intent is not simply aesthetic but deeply educational, giving both professionals and non-experts a clear and memorable way to understand what their readings mean. A blood pressure chart showing low, normal, elevated, and high ranges transforms medical measurements into something instantly interpretable by linking systolic pressure (the top number, reflecting pressure when the heart beats) and diastolic pressure (the bottom number, reflecting pressure when the heart relaxes). By converting abstract numbers into intuitive zones, a vector illustration becomes a bridge between data and understanding, making it much easier for patients, students, and health workers to recognize whether blood pressure is within a healthy range or moving toward risk. Instead of numbers floating without context, a visual chart grounds the values in meaning, turning a medical test into knowledge that can guide lifestyle decisions, routine monitoring, and awareness of warning signs.
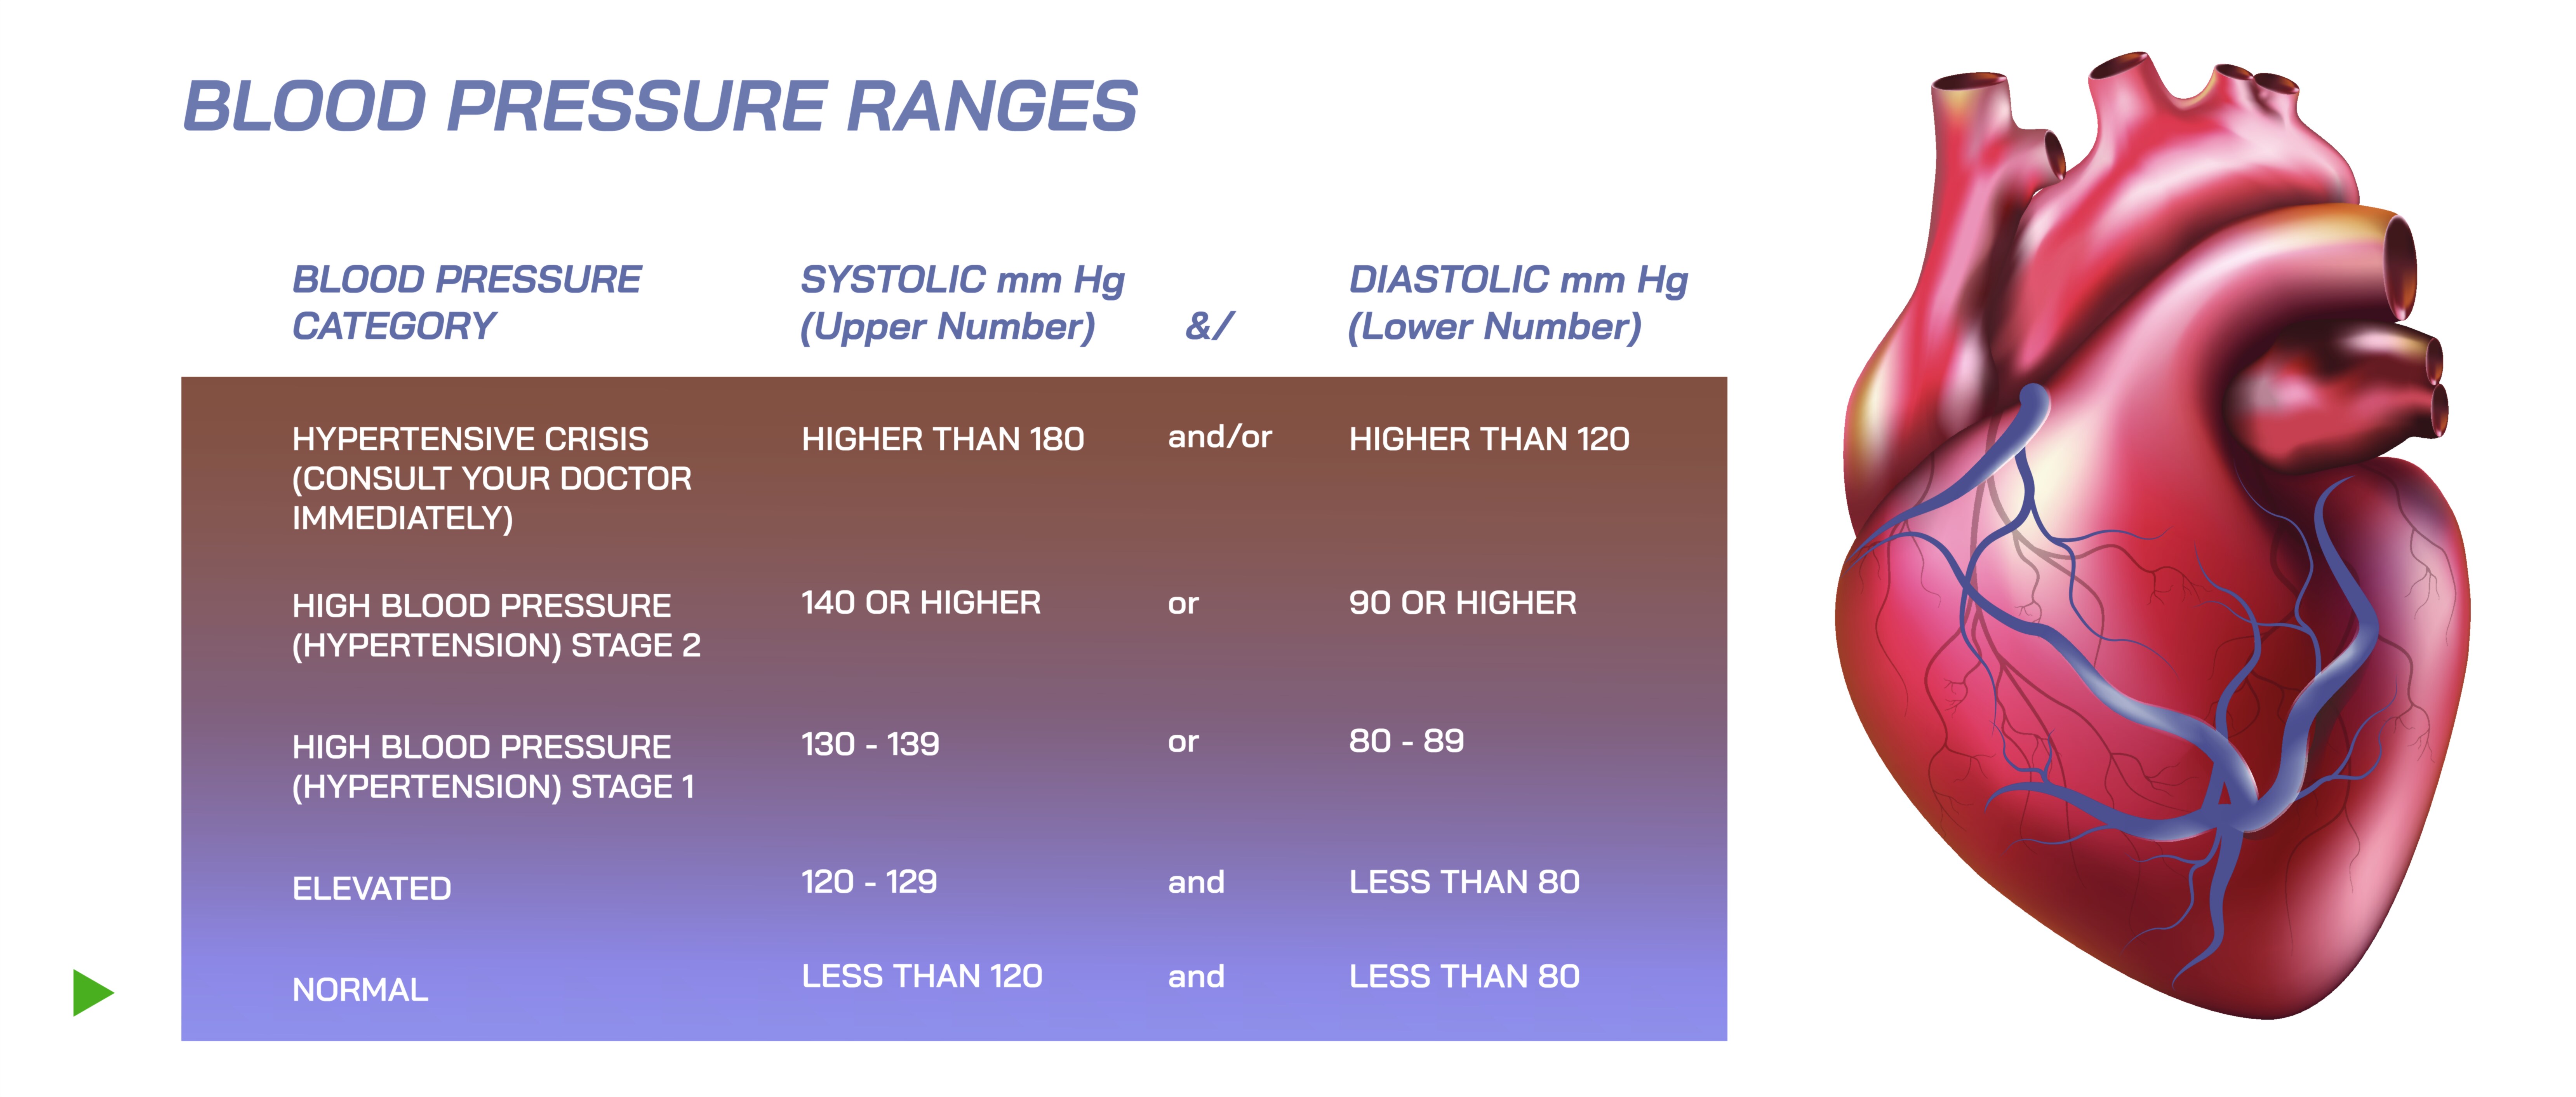
A typical educational blood pressure chart ranges from low readings at the bottom, through normal and elevated zones in the middle, to hypertension stages at the top. The normal range is visually the calmest part of the illustration because it represents the state in which the heart and arteries work smoothly, usually around 120/80 mmHg or below. Vector charts often highlight this area in green to convey safety and stability, expressing that the heart is not under excessive strain and that blood can circulate freely without damaging vessel walls. People who fall in this range are encouraged to maintain healthy lifestyle habits to preserve cardiovascular strength, because blood pressure naturally has a tendency to rise with age, inactivity, stress, weight gain, and dietary salt intake. In the context of visual learning, the normal zone serves as a reference point against which all other values can be compared.
Below the normal range lies low blood pressure, which is usually illustrated in cool or muted blues to represent reduced pressure and diminished force. Low blood pressure, often considered around 90/60 mmHg or lower, is not inherently harmful for every person, and many individuals live healthily with low readings without symptoms. The vector illustration makes this important distinction visually by depicting low blood pressure not as a danger zone by default but as a caution zone that becomes a concern when associated with dizziness, fatigue, fainting, blurred vision, dehydration, or shock. On the chart, this area serves as a reminder that blood pressure that is too low means that oxygen delivery to organs may be inadequate, especially when standing suddenly or during dehydration, illness, or bleeding. Instead of implying alarm, the illustration educates viewers that low pressure is a condition to monitor — particularly in elderly adults, pregnant individuals, people on certain medications, and patients recovering from illness — because it affects daily functioning and balance even if it does not damage blood vessels the way high pressure can.
Above the normal zone lies the region of rising risk: elevated blood pressure and hypertension. These stages are visually represented in warmer and increasingly intense colors, such as yellow transitioning to orange and finally red, symbolizing progressively higher strain on the heart and arteries. Elevated blood pressure, typically around 120–129 systolic with less than 80 diastolic, is not classified as hypertension yet, but it signals a direction of change. The vector illustration portrays this stage with careful contrast because it marks the turning point where lifestyle habits can prevent further progression. Without intervention — healthier diet, lower salt intake, regular physical activity, stress reduction, and consistent sleep — this stage commonly transitions into hypertension, and the graphical representation helps communicate urgency without panic.
Hypertension Stage 1 and Stage 2, shown in deeper orange and red respectively, represent sustained high readings. Stage 1 (usually 130–139 systolic or 80–89 diastolic) is the point where many people may not yet feel symptoms but where artery walls slowly begin to endure structural damage. The illustration often depicts this range with stronger saturation because it signals that medical guidance is strongly advisable and that medication may be considered alongside lifestyle changes depending on risk level. Stage 2 hypertension (typically 140/90 mmHg or higher) is visually the most alarming part of the chart because chronic high pressure is one of the leading silent threats to health. The vector chart communicates this effectively by associating Stage 2 with bright red zones that clearly mark danger, calling attention to the increased risk of stroke, heart attack, kidney disease, heart failure, aneurysm formation, and long-term vascular damage. The visual helps viewers remember that high blood pressure often has no symptoms until damage has already been done, which is why it is known as a silent killer.
In the most extreme range, hypertensive crisis (generally above 180 systolic or 120 diastolic) is usually shown in flashing or bright red, sometimes paired with an emergency symbol to emphasize that immediate medical care is necessary. In this state, blood pressure readings are dangerously high, and the risk of life-threatening events becomes acute. The illustration conveys this emergency status by placing the hypertensive crisis zone clearly apart from the rest — visually loud, unmistakable, and intentionally designed to signal that this is not a reading to ignore or postpone. The purpose of this depiction is not to frighten but to save lives by ensuring that anyone who sees such numbers on a device understands the urgency.
A vector illustration for blood pressure ranges also helps viewers learn through layout and memory because the chart intuitively maps values in ascending order. The viewer absorbs that high blood pressure is above normal and low blood pressure is below it, reinforcing the conceptual structure of medical risk at a glance. The clean lines, crisp fonts, and scalable vector design ensure that the chart stays readable whether it appears on a medical poster, app interface, textbook page, clinic wall, school educational board, or social media infographic. Designers often integrate icons — a heart symbol to represent cardiovascular function, an arm cuff to represent blood pressure measurement, or pulse waves to indicate circulation — to reinforce the connection between numbers and biology. These visual cues help non-professionals understand that blood pressure is not an abstract statistic but a reflection of heart workload, arterial resistance, and whole-body health.
The purpose of the illustration is also practical: it encourages routine monitoring. In an era where home blood pressure monitors and digital health apps have become extremely common, the visual chart empowers individuals to interpret their own readings without waiting for medical appointments. It motivates people to maintain awareness before symptoms appear and before disease develops. Because the chart is printable, displayable, and universally readable, it becomes an everyday educational tool that supports preventive health rather than reactive treatment.
Beyond diagnosis and self-monitoring, the blood pressure range chart also supports educational institutions and healthcare professionals by providing a visual anchor for classroom lessons, nursing training, medical instructions, patient counselling sessions, first-aid training programs, and awareness campaigns. Students learn faster when they can see patterns rather than memorizing digits, and patients regain confidence when they know how to track progress and make meaningful lifestyle adjustments based on real numbers rather than fear or guesswork.
In its deepest meaning, a blood pressure vector illustration does not simply categorize numbers — it communicates responsibility, awareness, and empowerment. It reminds every viewer that the heart is not silent but speaks through measurable patterns and that listening to those patterns through regular monitoring and educated interpretation prevents suffering that would otherwise remain invisible. By translating medical science into visual clarity, the illustration supports better decisions, healthier behavior, and early intervention before harm occurs. It is not just a chart — it is a visual pathway to understanding cardiovascular health, taking control of well-being, and recognizing that even small readings carry powerful messages about the body’s inner life.