Very Useful Stock Market Chart Patterns — Identification and Trading Insights
Stock market chart patterns are essential tools for traders and investors, providing visual cues about potential price movements and market sentiment. Recognizing these patterns enables participants to anticipate trend reversals, continuation signals, and breakout opportunities, improving trading accuracy and risk management.
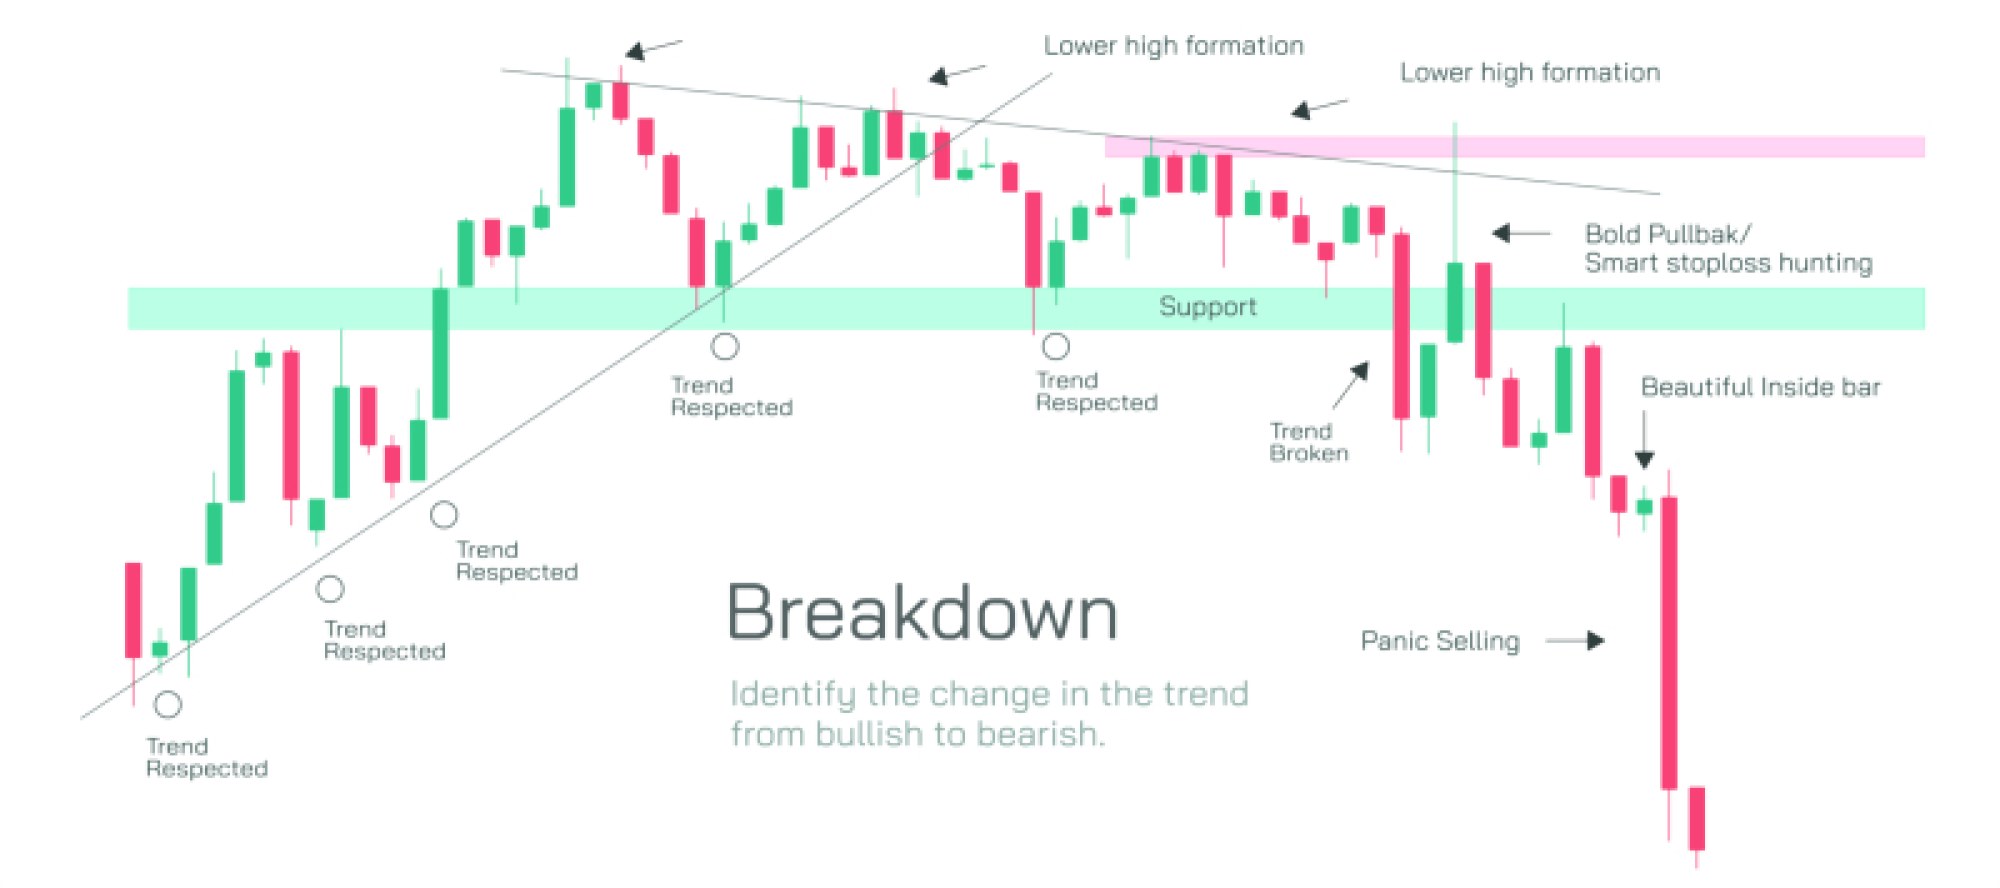
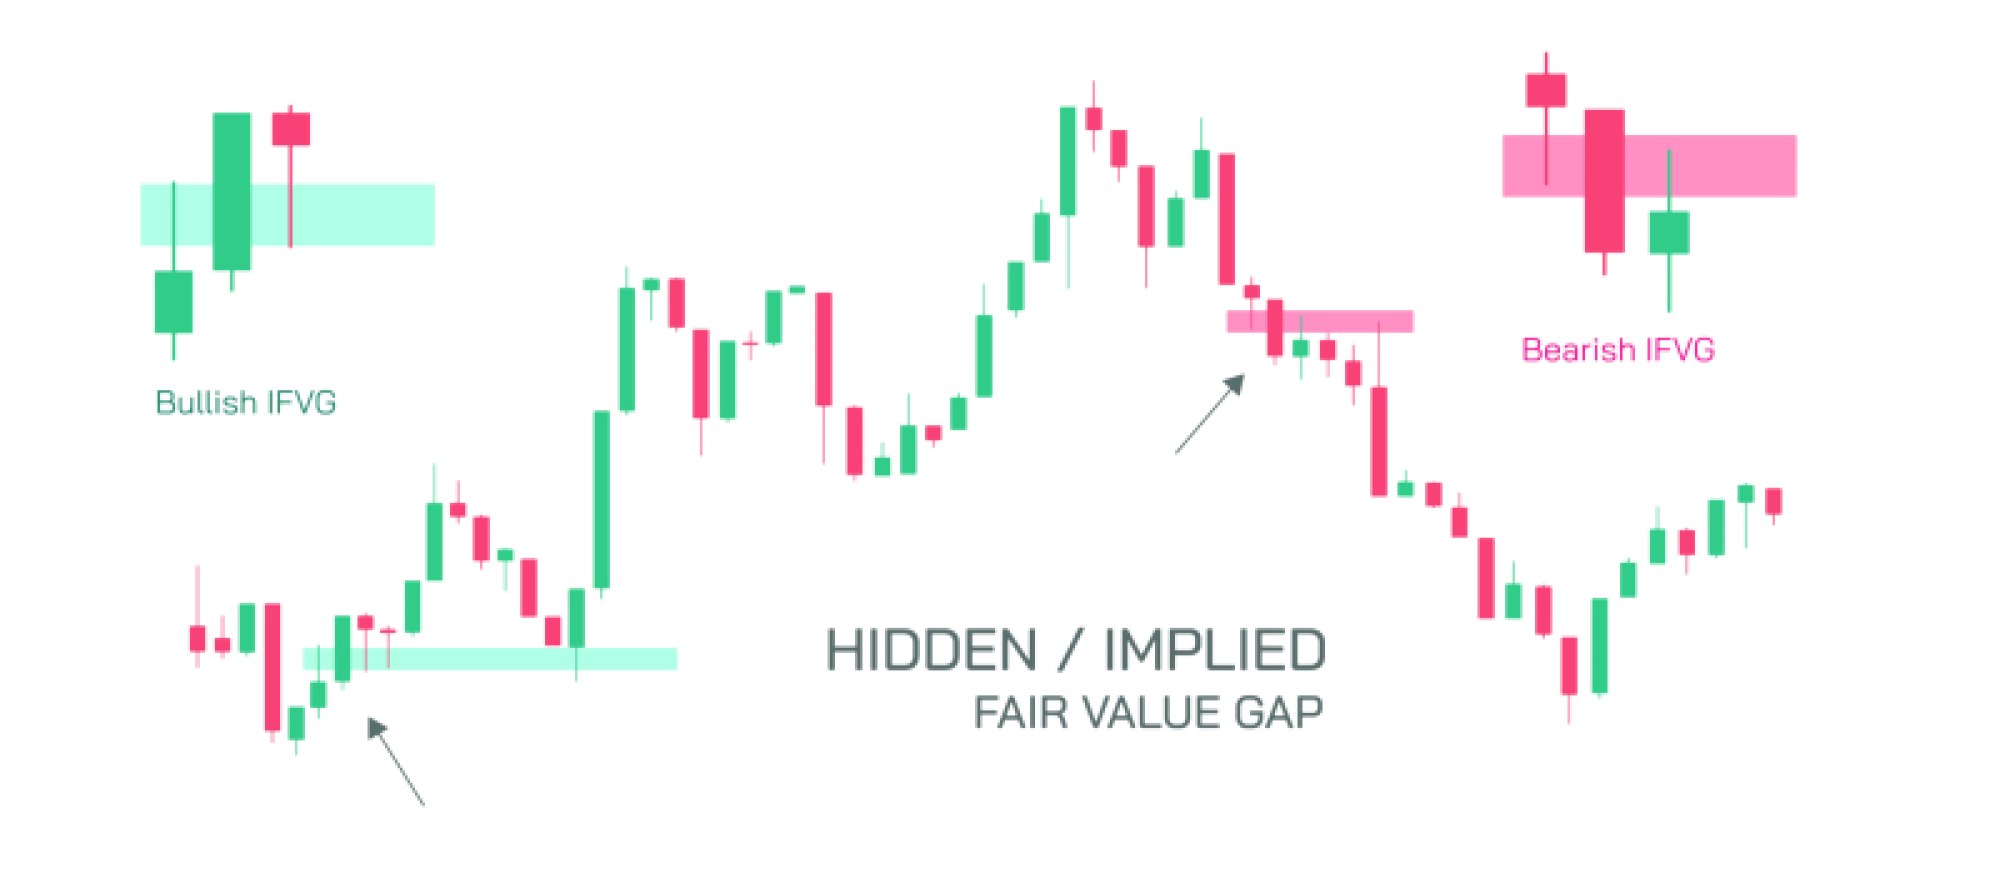
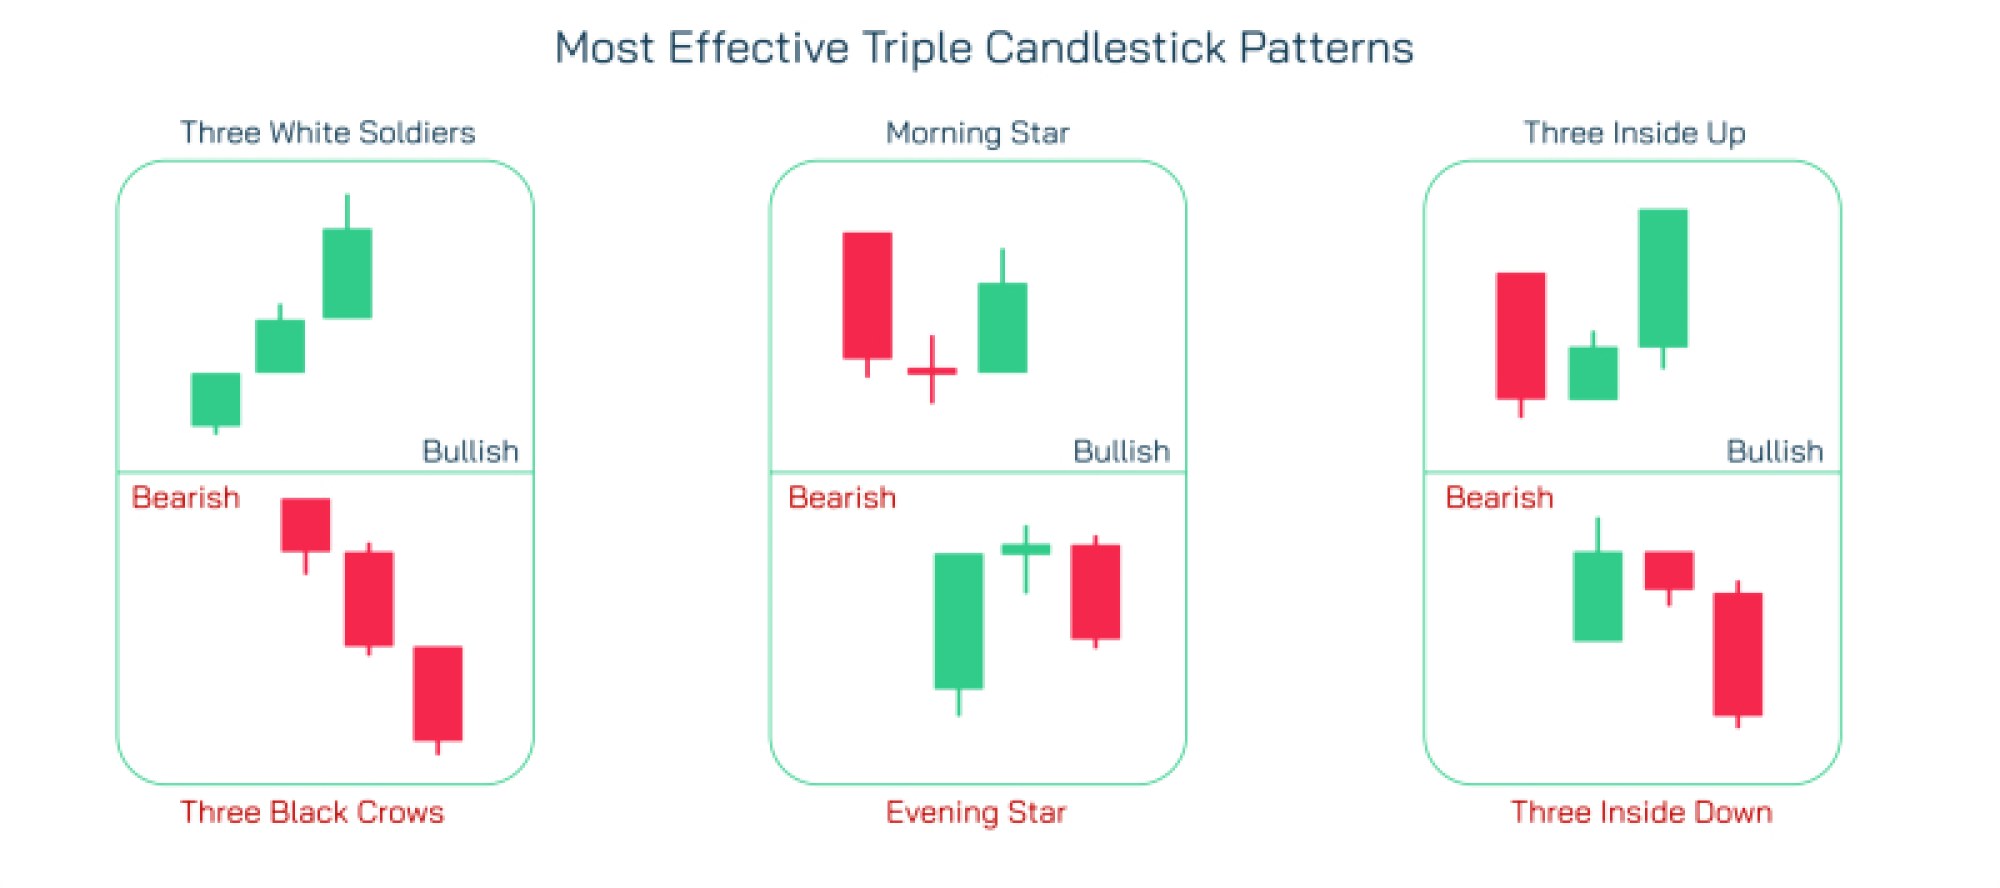
Among the most useful chart patterns are reversal patterns, which indicate a possible change in trend direction. Head and shoulders patterns, for example, suggest a trend reversal from bullish to bearish, while inverse head and shoulders signal a potential shift from bearish to bullish. Double tops and double bottoms also indicate trend reversals, helping traders identify key price levels where buying or selling pressure may dominate.
Continuation patterns, on the other hand, indicate that the current trend is likely to persist. Triangles — ascending, descending, or symmetrical — show periods of consolidation followed by trend continuation once price breaks out. Flags and pennants are short-term consolidation patterns that often precede strong directional moves, providing opportunities for traders to enter positions in the direction of the trend. The cup and handle formation is another powerful pattern signaling potential bullish continuation, often used to identify breakout points after a consolidation period.
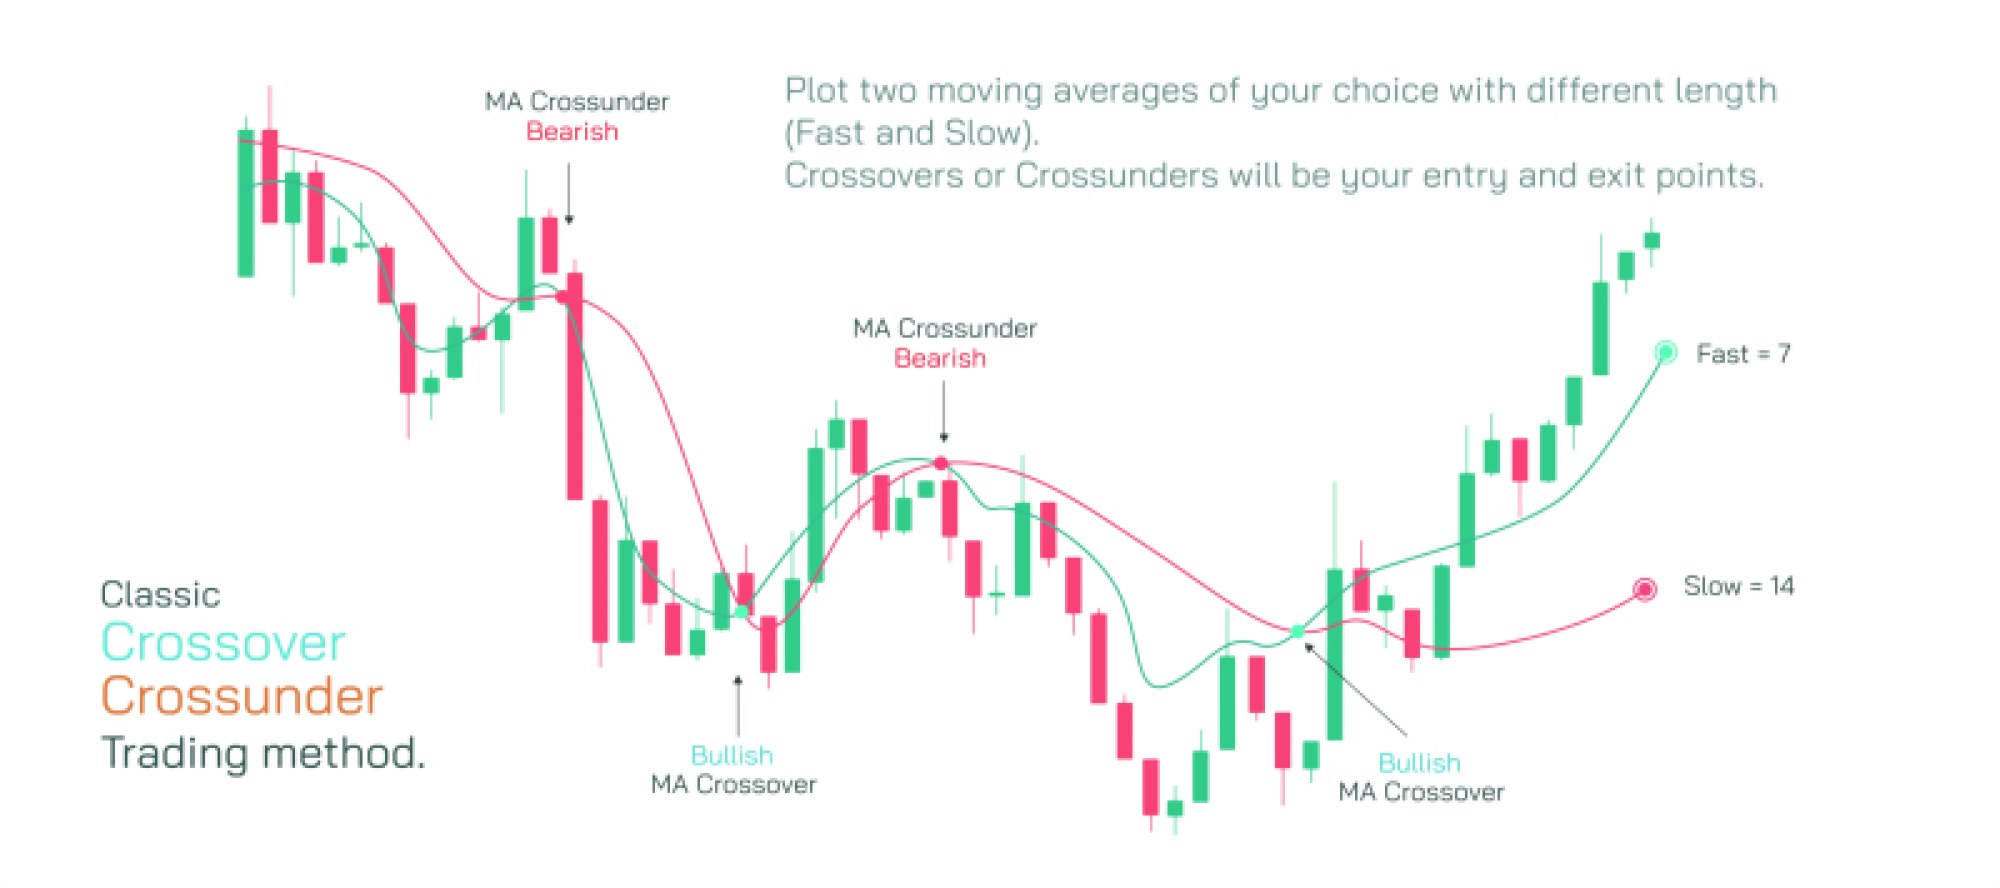
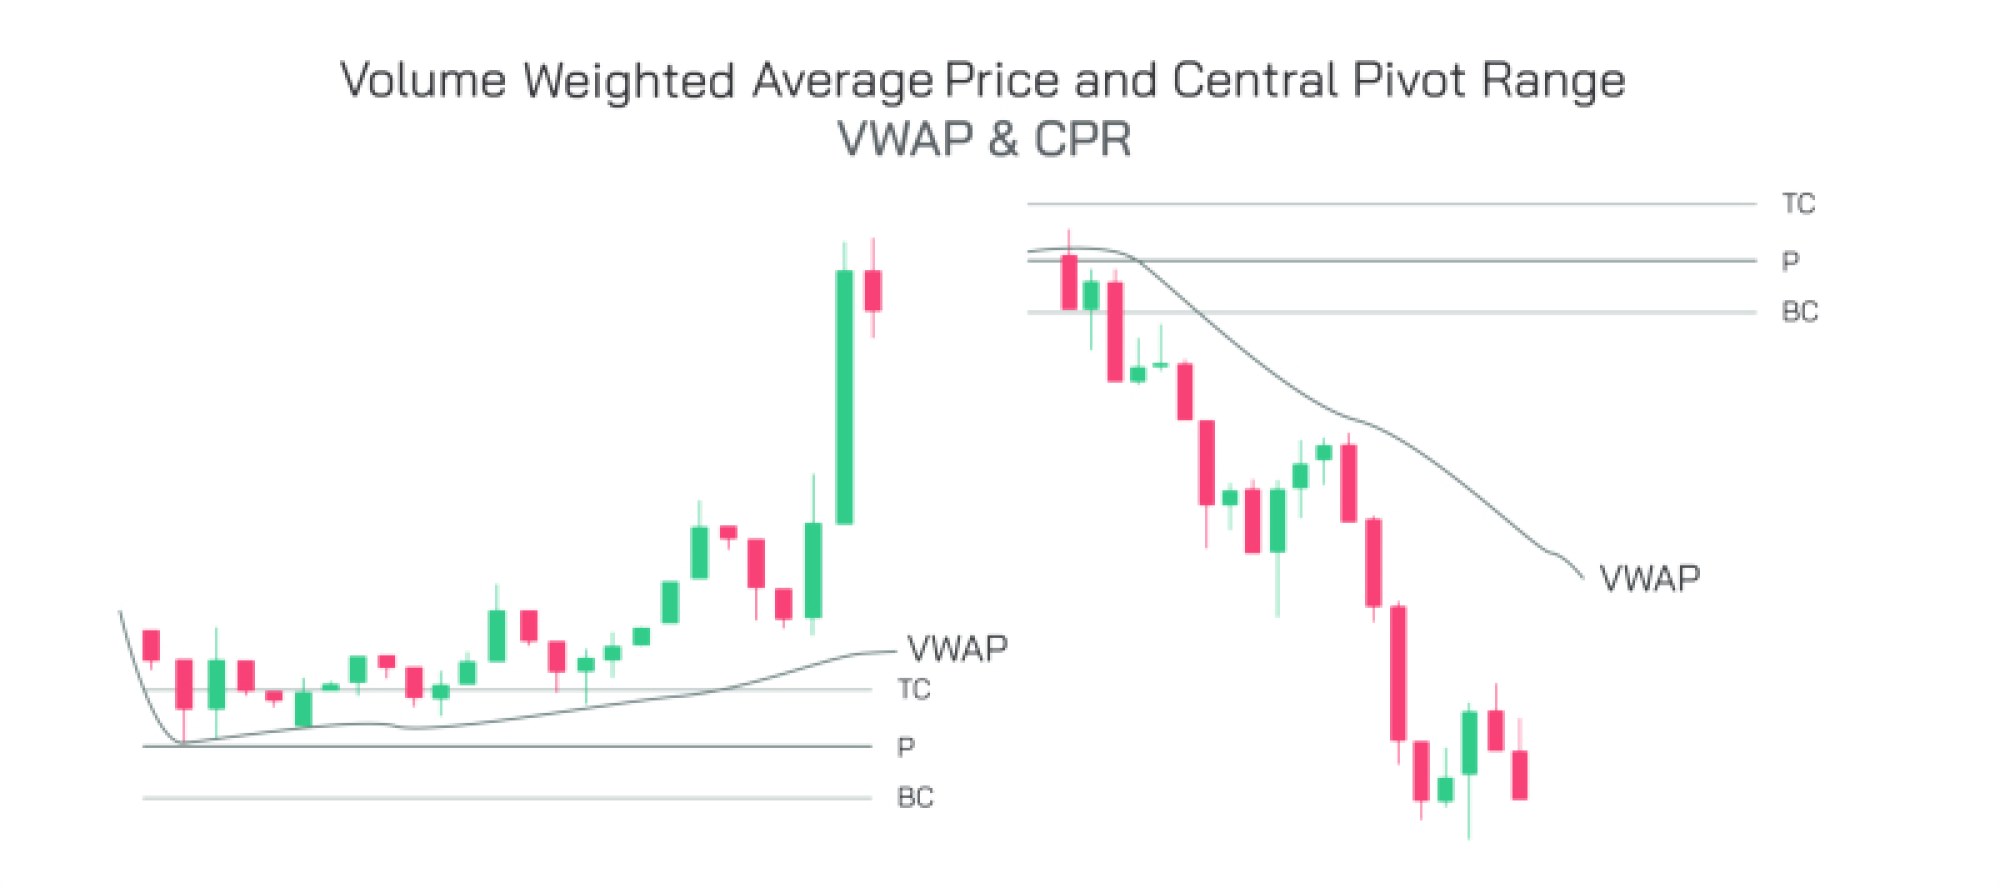
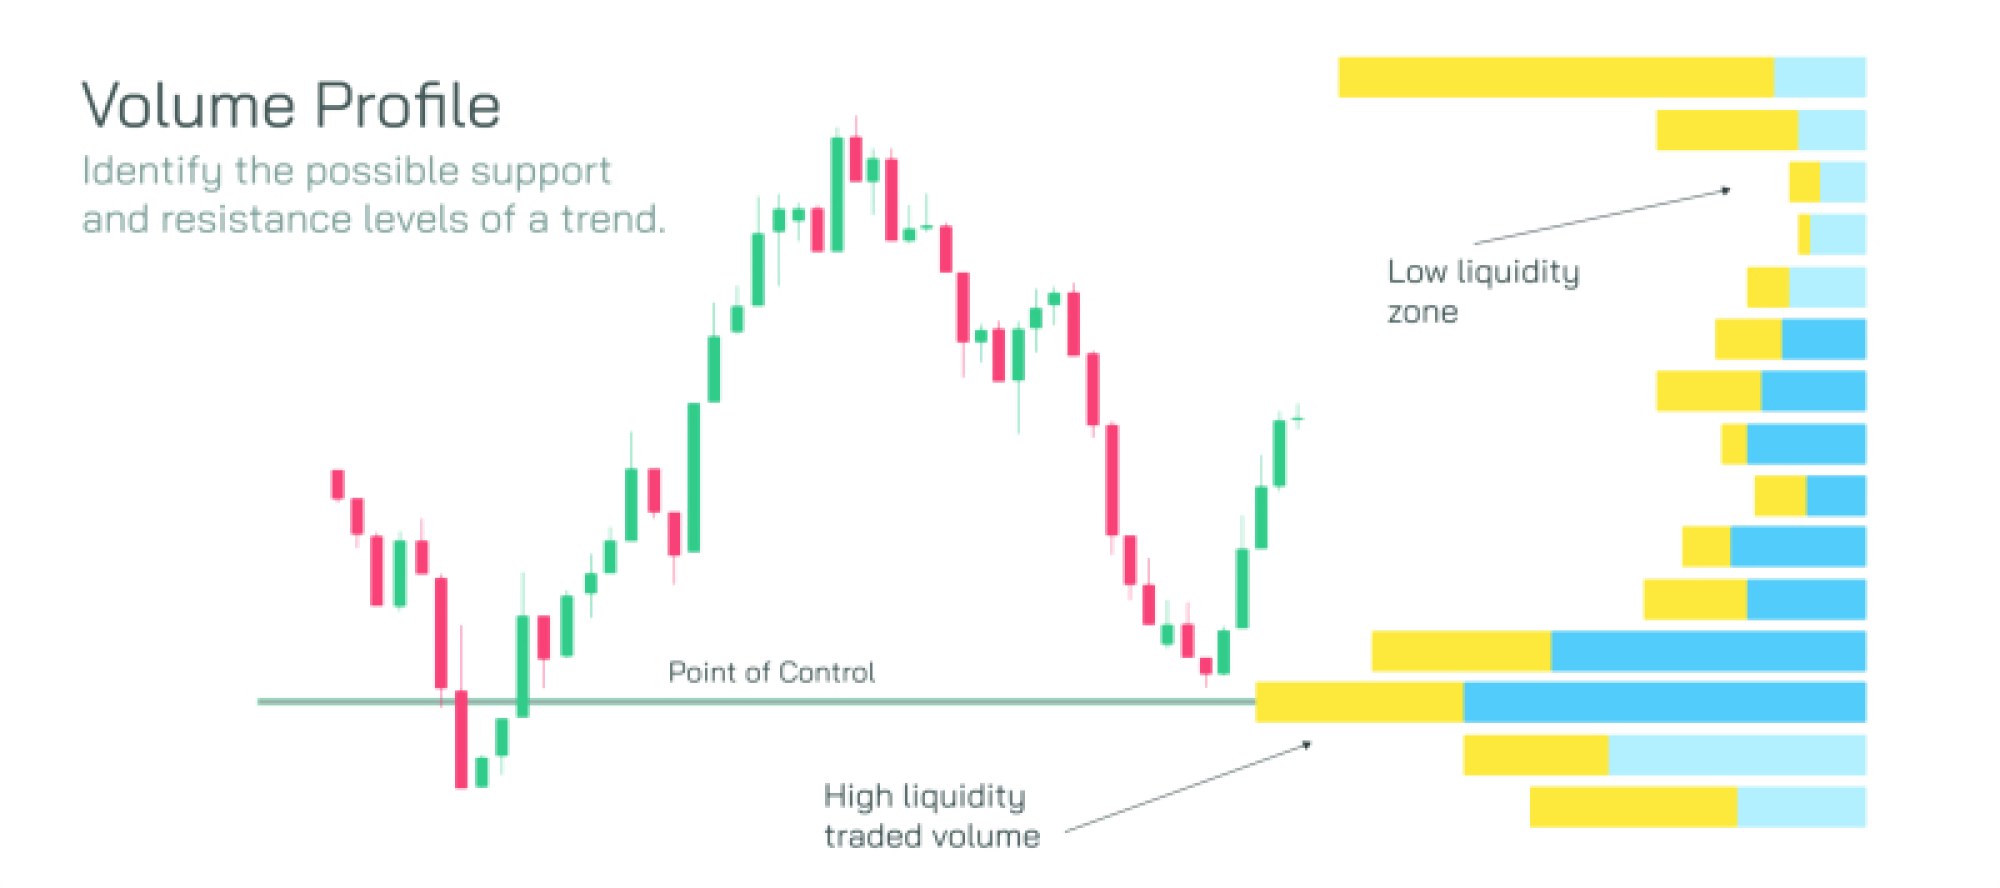
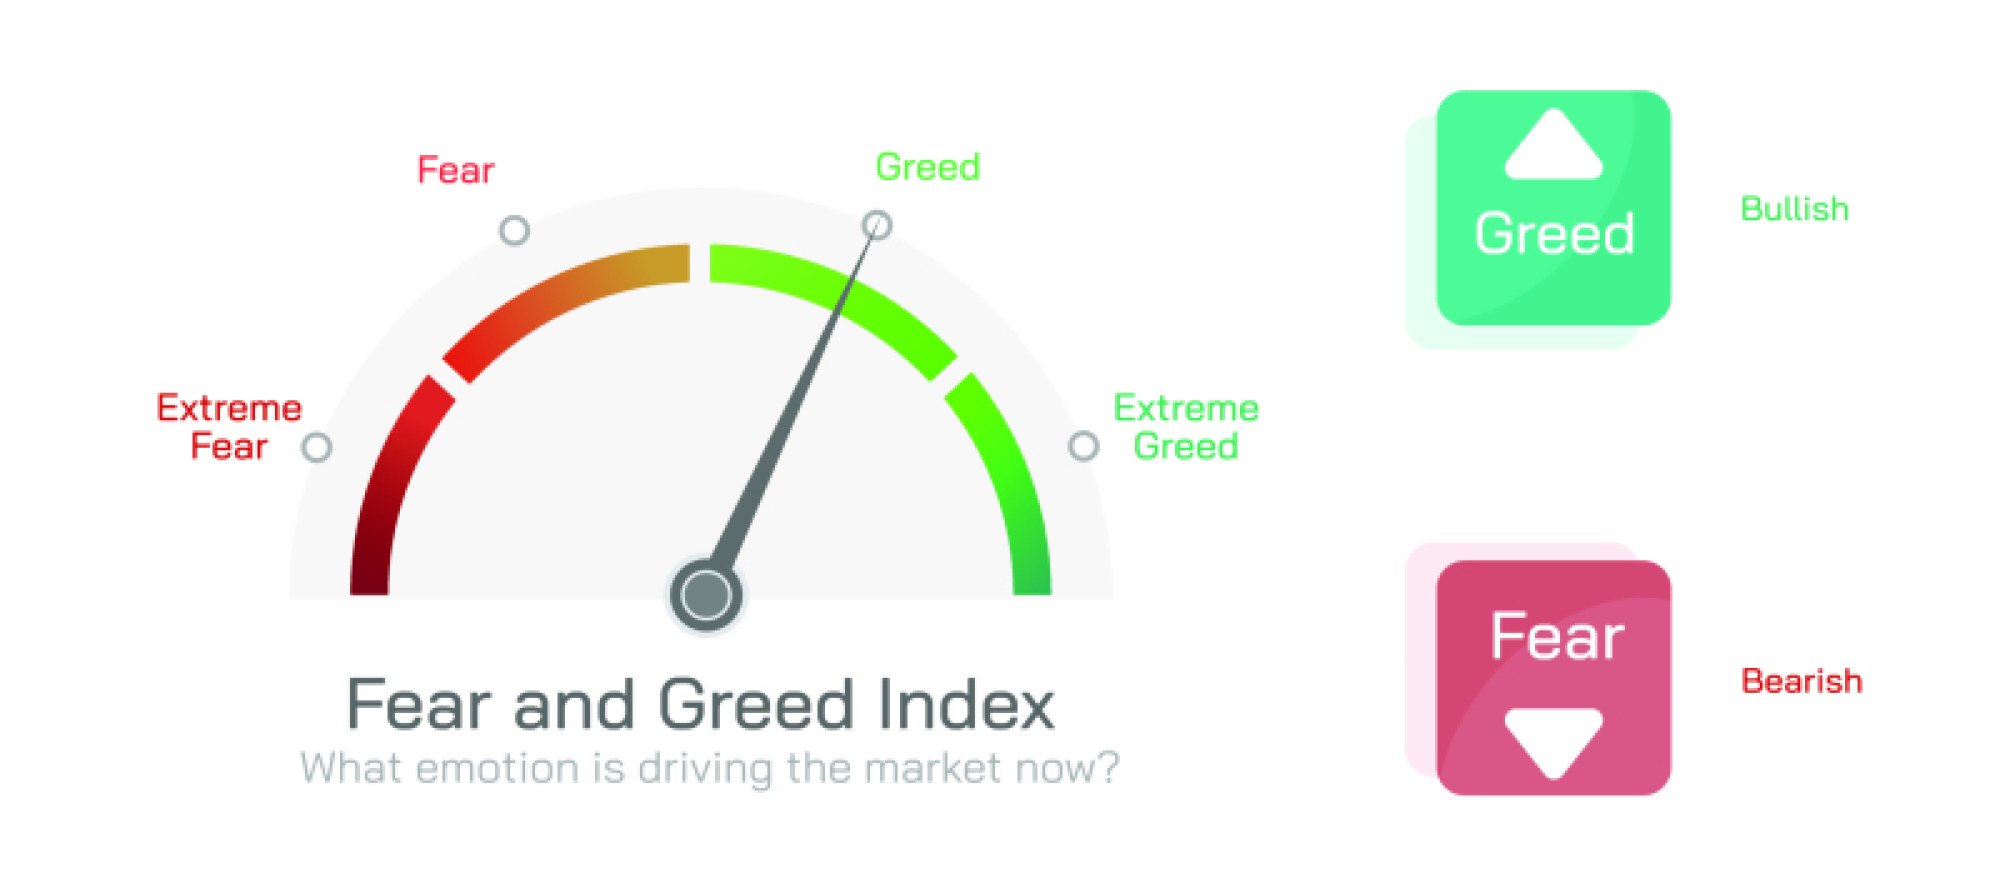
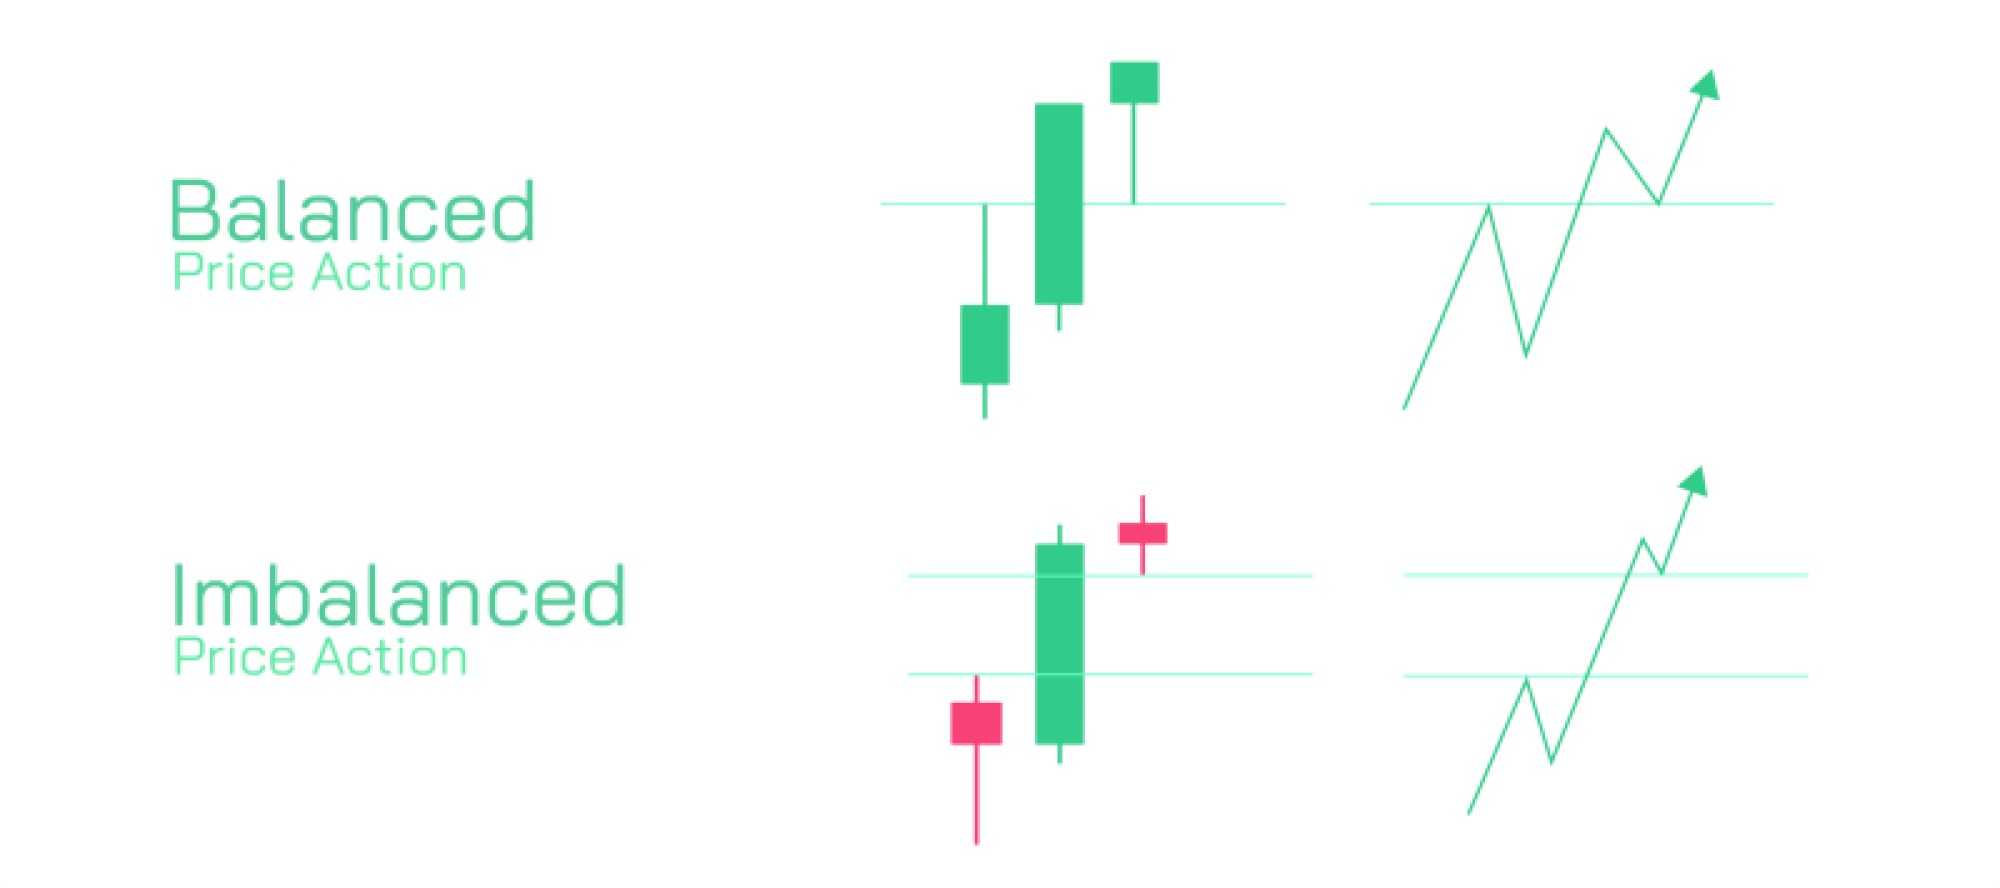
Effective use of chart patterns requires combining pattern recognition with additional technical indicators such as trend lines, moving averages, and volume analysis. Volume, in particular, confirms the strength of breakouts or reversals, while trend lines help visualize support and resistance levels that validate pattern predictions. Understanding market psychology behind these patterns — including buyer and seller dominance and supply-demand imbalances — enhances a trader’s ability to make informed decisions.
Educational illustrations of highly useful stock market chart patterns highlight key formations, entry and exit points, and potential price targets. These diagrams are invaluable for traders, analysts, and students of finance, offering a clear understanding of market behavior, trend signals, and strategic trading opportunities. Mastering chart patterns empowers market participants to anticipate price movements, improve decision-making, and enhance overall trading performance.