Understanding How Volume Profile Works in the Stock Market
Volume profile is a powerful analytical tool in stock trading that displays the distribution of traded volume across different price levels rather than time. Unlike traditional volume indicators that show total traded volume per time period, volume profile focuses on where the market participants actively traded at specific prices, helping traders identify key support and resistance zones, liquidity areas, and market activity concentration. Understanding how volume profile works is essential for both intraday and swing traders seeking high-probability trading opportunities.
Volume profile is represented as a horizontal histogram along the price axis of a chart. Peaks in the histogram indicate high volume nodes (HVNs), where significant trading activity occurred, suggesting strong support or resistance levels. Valleys or low volume nodes (LVNs) indicate areas of low interest, often representing zones where price may move quickly due to minimal liquidity. These insights allow traders to anticipate potential reversals, breakouts, and trend continuations.
One of the key concepts in volume profile is the Point of Control (POC), which is the price level with the highest traded volume. POC often acts as a magnet for price, as the market seeks equilibrium around areas of high participation. Other important levels include value areas, typically defined as the range where 70% of the volume occurred, providing traders with a visual guide to fair price zones versus overbought or oversold conditions.
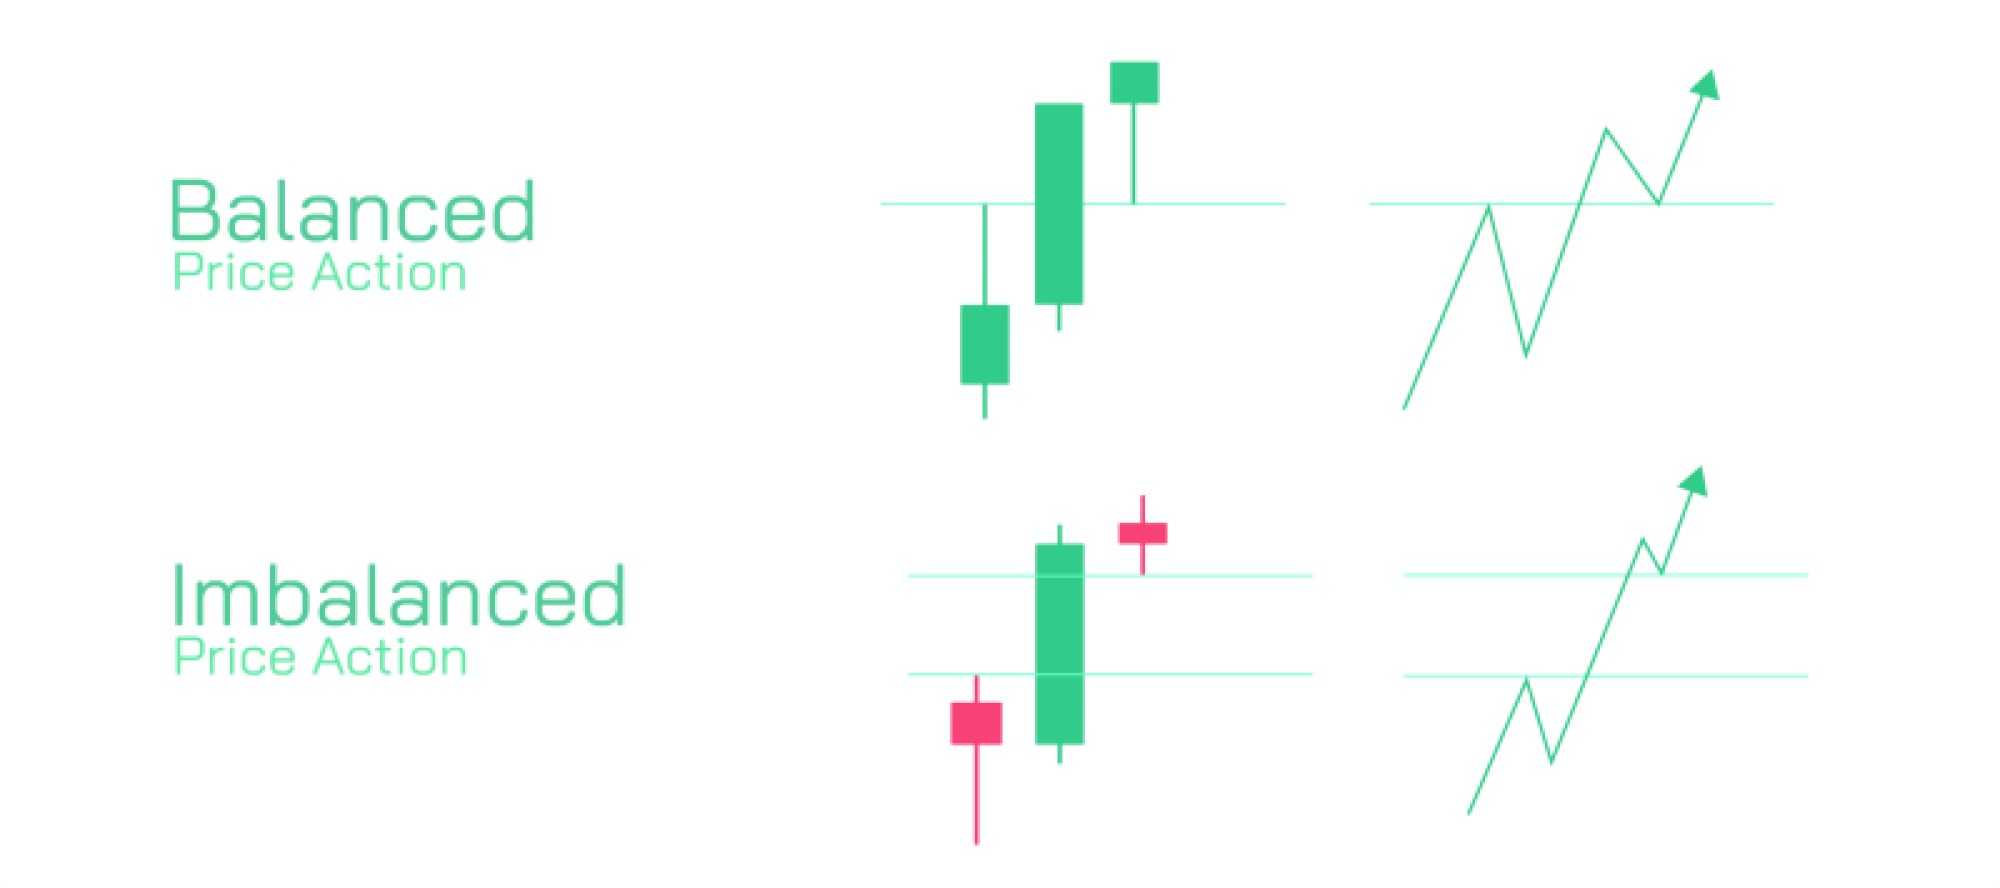
Volume profile also reveals market structure and trader behavior. For example, if price moves through a low volume node quickly, it suggests imbalance, indicating that buyers or sellers dominated temporarily and the market could return to fill that gap. By combining volume profile analysis with other technical tools like support and resistance, moving averages, and candlestick patterns, traders can design strategic entries and exits, manage risk effectively, and improve trade planning.
In conclusion, understanding how volume profile works equips traders with a deeper perspective of market activity beyond simple price charts. It highlights the relationship between price and volume, identifies liquidity zones, and provides actionable insights for trend continuation, reversals, and high-probability trading setups. Mastery of volume profile enhances a trader’s ability to read market dynamics, optimize entries and exits, and make disciplined, informed decisions in both volatile and stable market conditions.