Stock Market RSI Divergence — Identifying Trend Reversals and Trading Signals
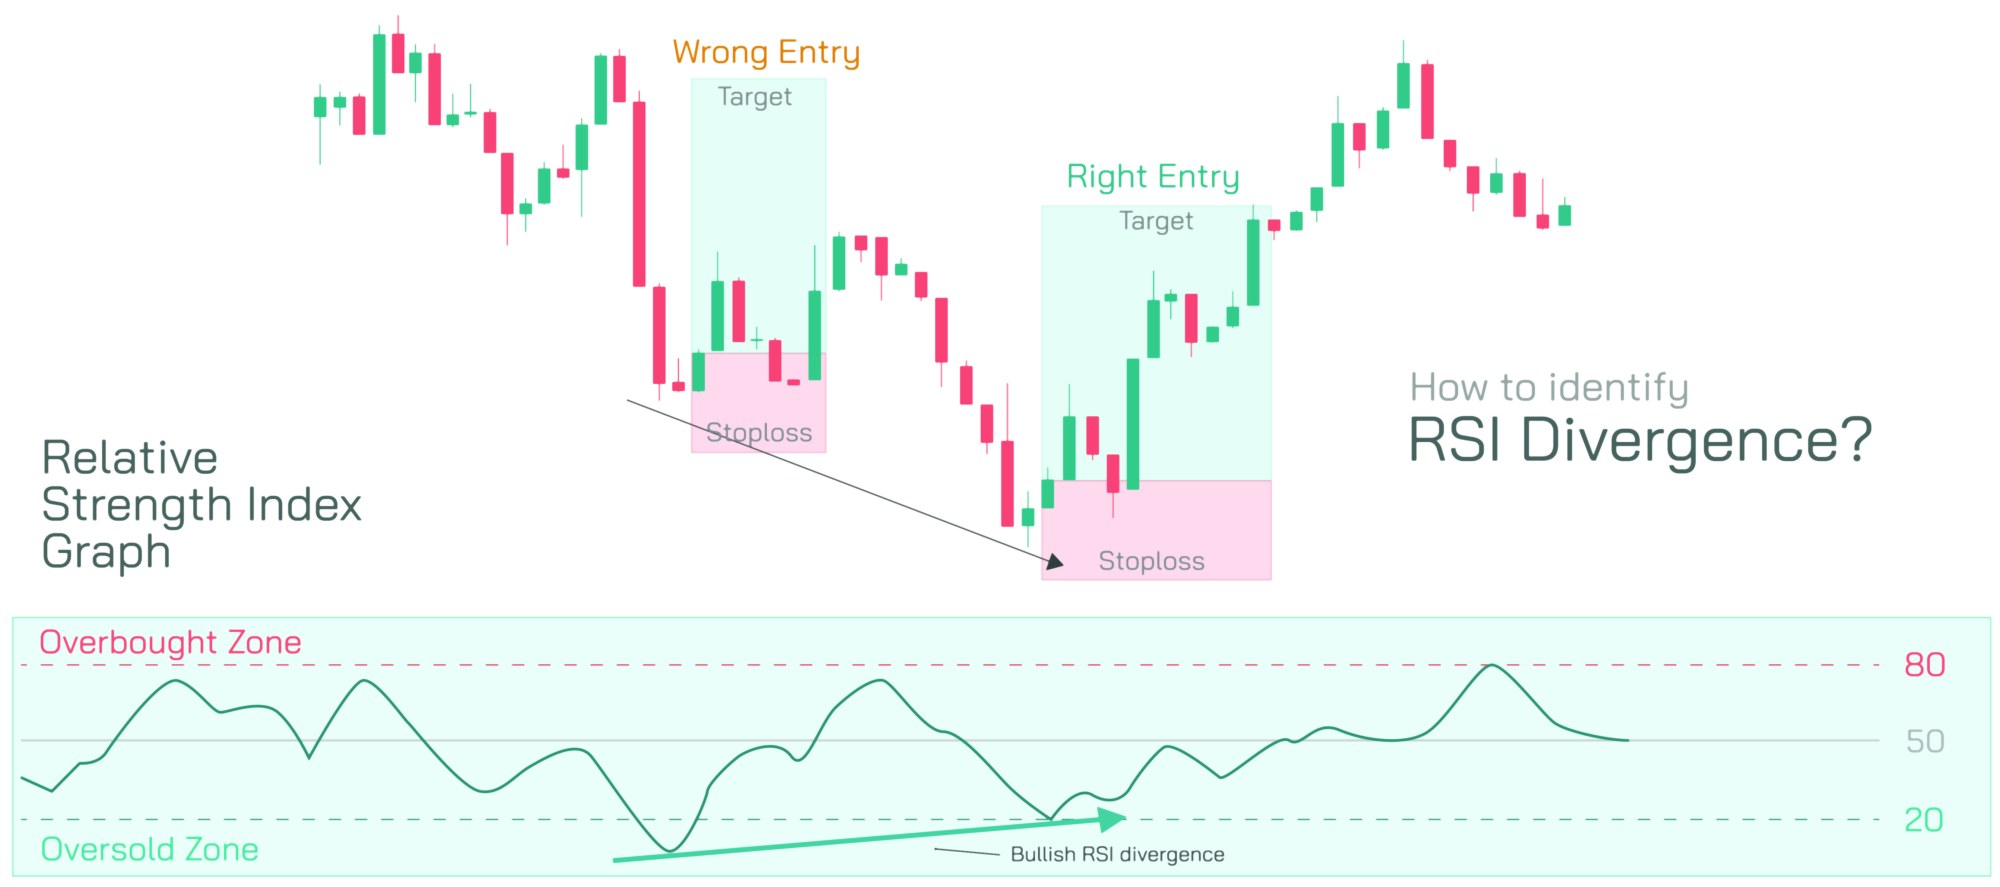
100. RSI divergence occurs when the price of a stock moves in one direction, while the RSI indicator moves in the opposite direction, signaling weakening momentum and a possible reversal in trend.
A bullish divergence happens when the price forms lower lows, but the RSI forms higher lows. This indicates that while the stock price is decreasing, the downward momentum is slowing, suggesting a potential upward reversal. Traders often use bullish divergence to identify buying opportunities in anticipation of a trend change. Conversely, a bearish divergence occurs when the price forms higher highs, but the RSI forms lower highs. This signals that upward momentum is weakening, even though prices continue to rise, indicating a potential downward reversal. Bearish divergence can help traders anticipate selling opportunities or protect gains.
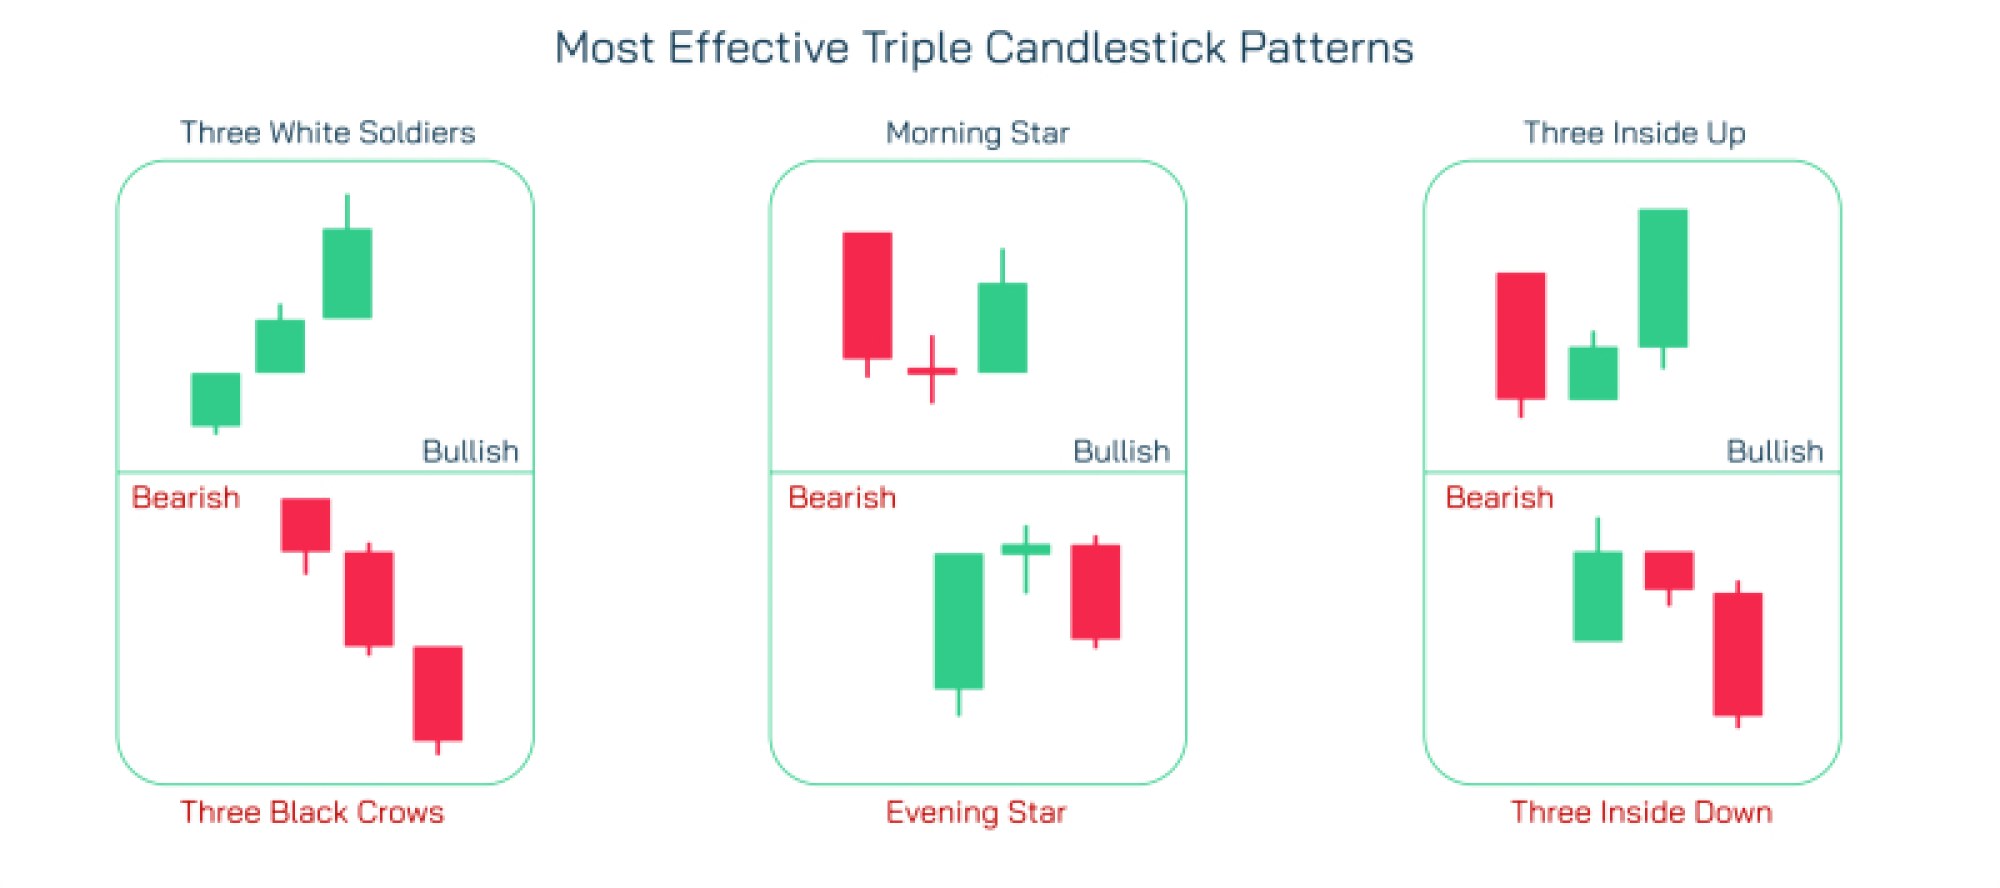
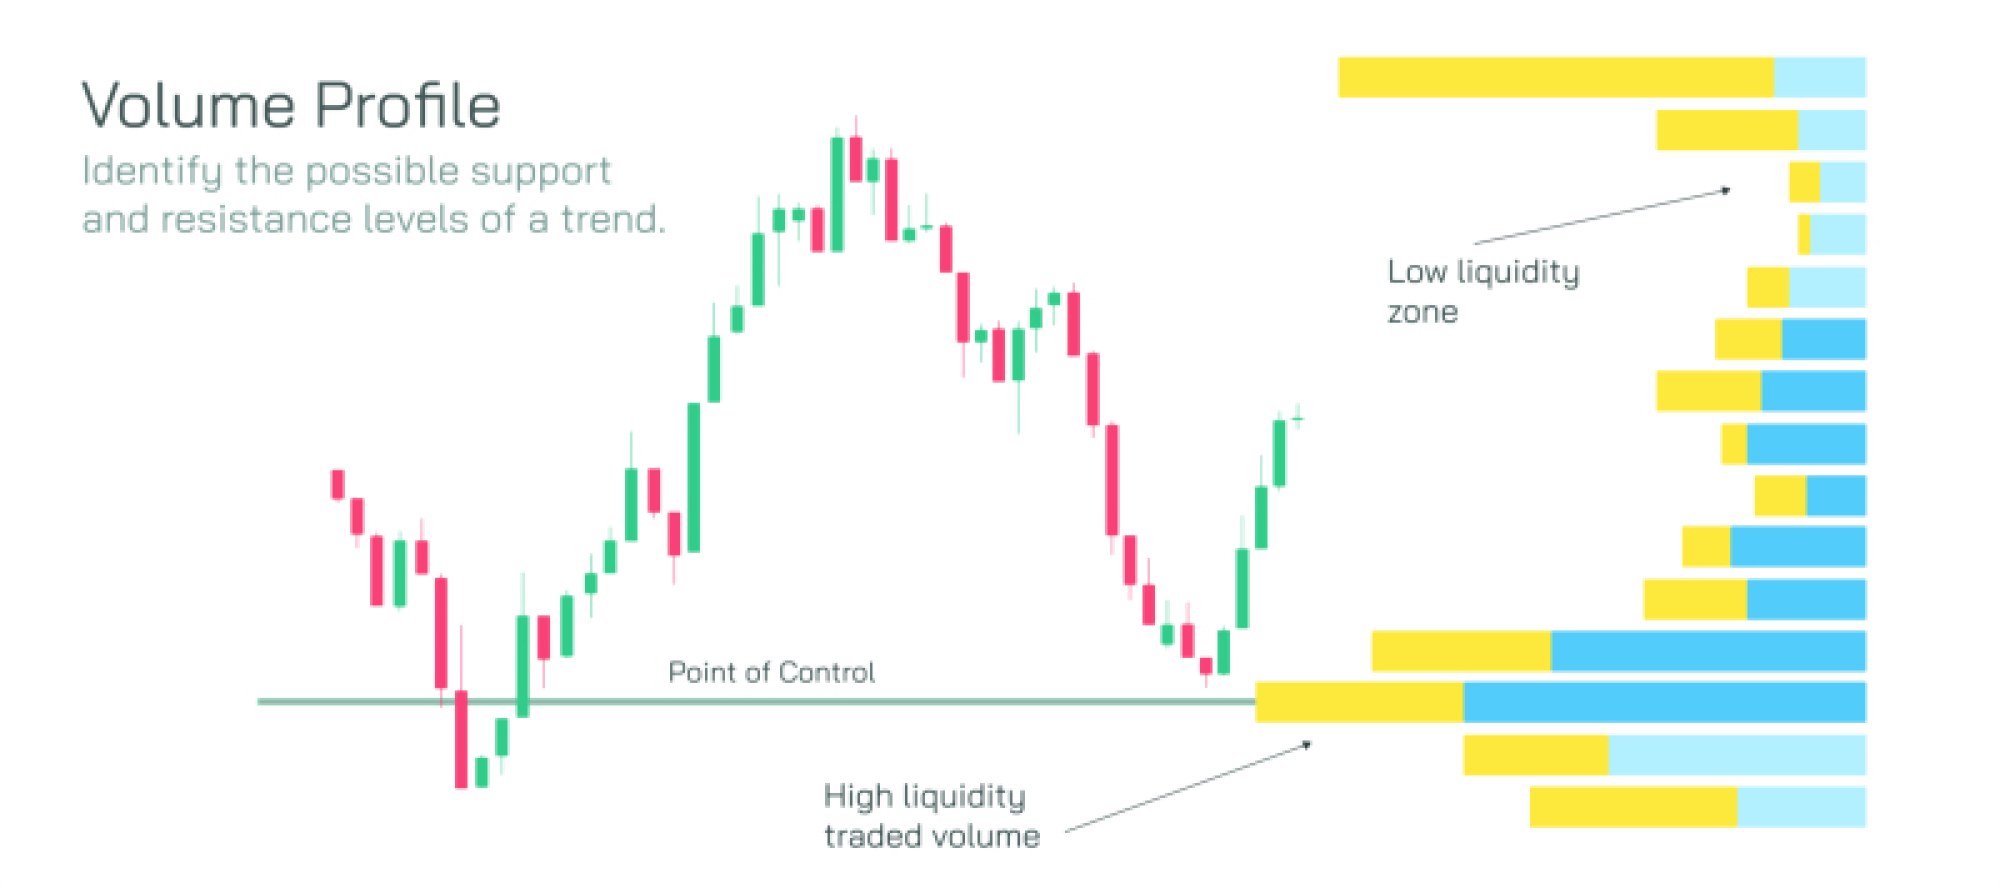
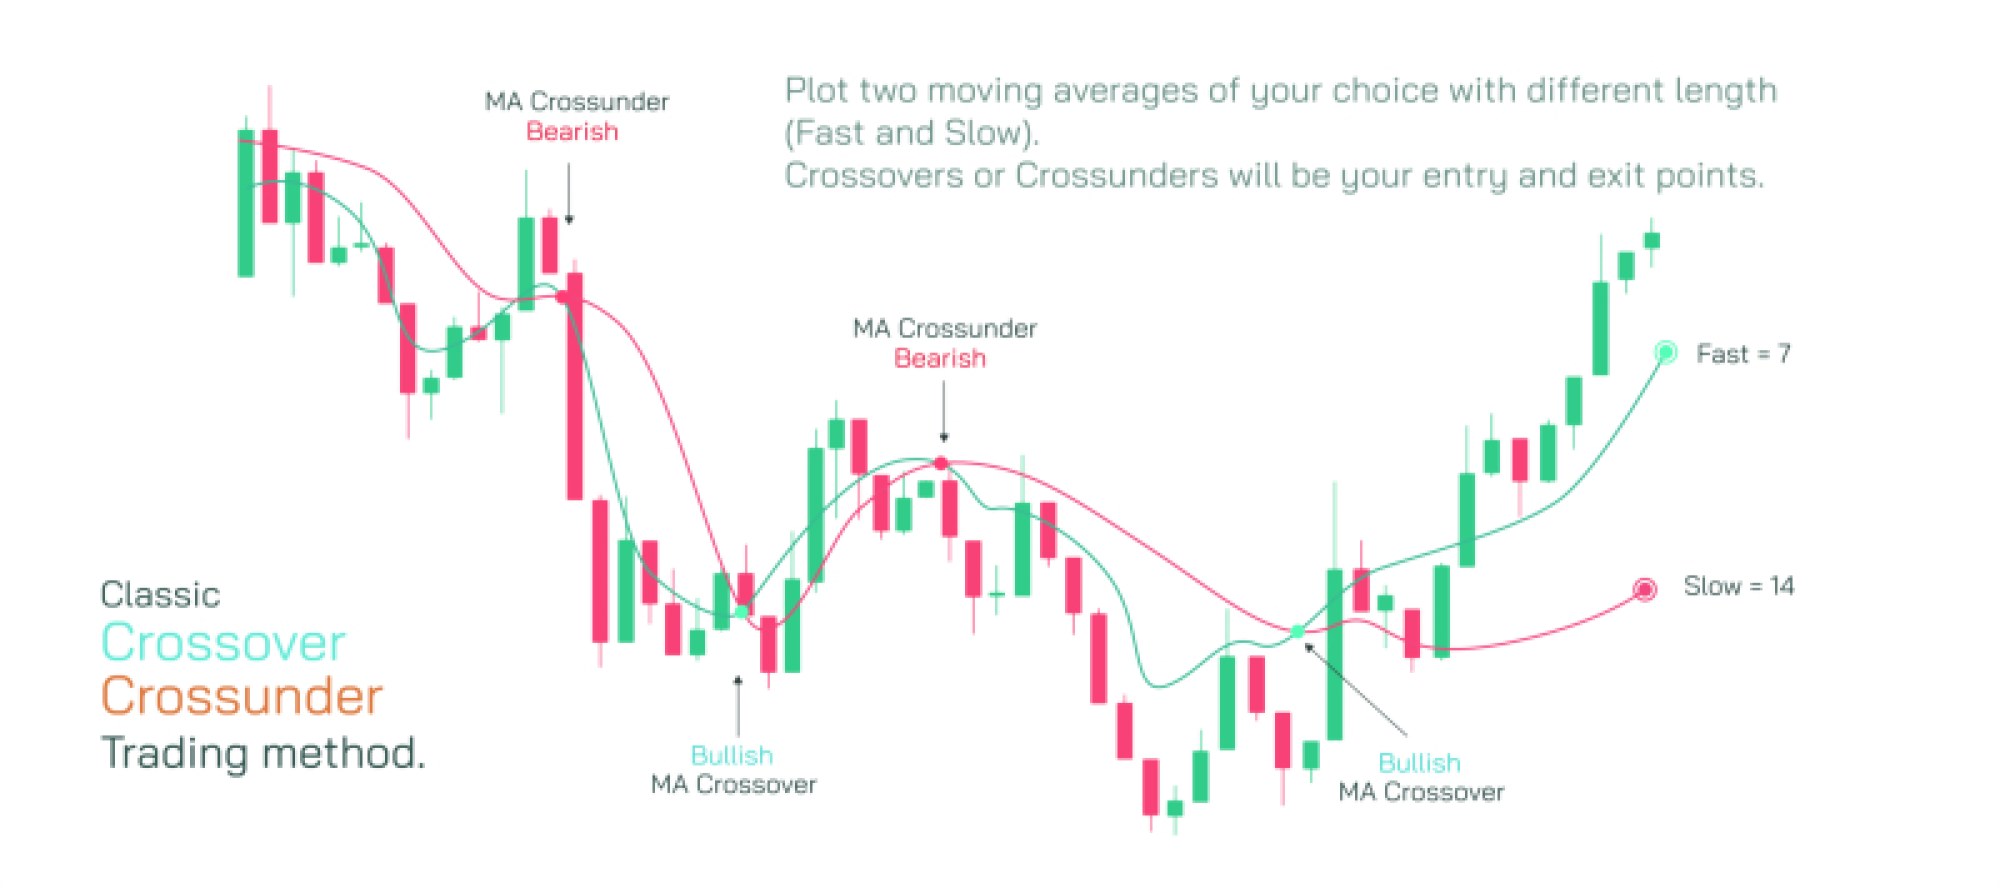
RSI divergence is highly valuable because it provides early warning signals of trend exhaustion before price movement confirms the reversal. It allows traders to plan entries, exits, or hedges based on momentum shifts rather than waiting for price patterns alone. Divergence is commonly combined with support and resistance levels, trend lines, and candlestick patterns to improve accuracy and reduce false signals. Volume analysis and other indicators are often used alongside RSI divergence to confirm the strength of the potential reversal.
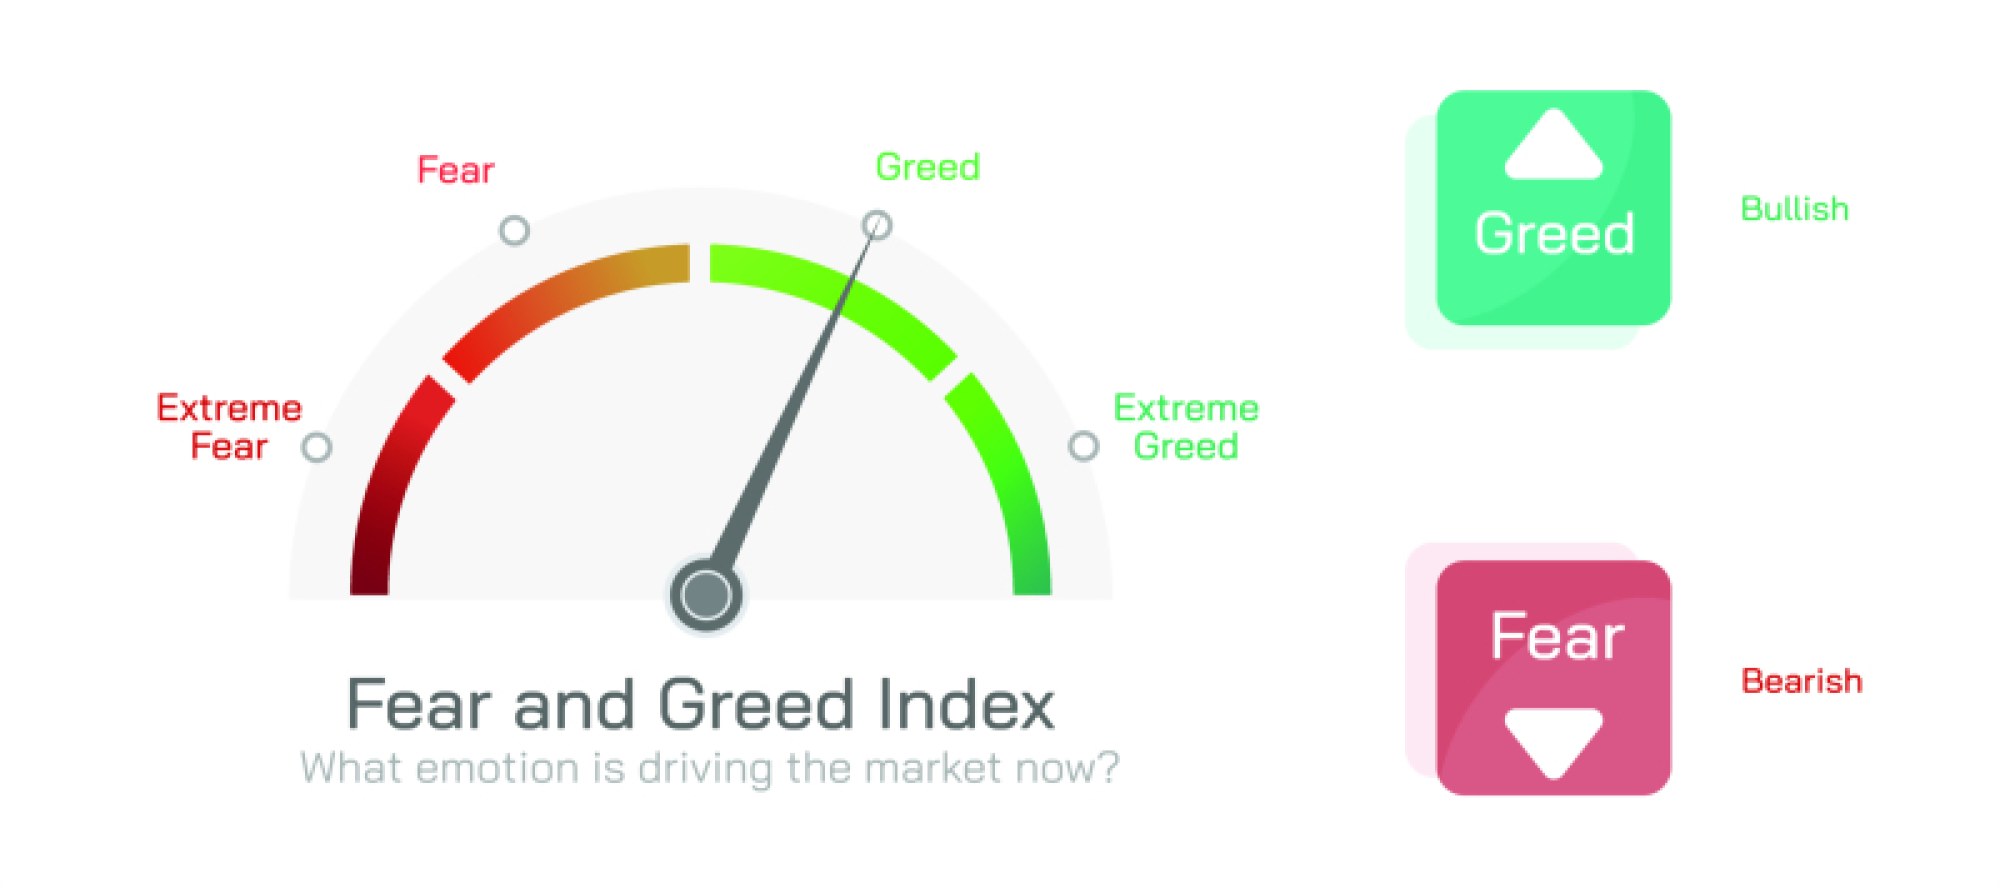
Understanding RSI divergence also provides insight into market psychology. Divergence reflects changes in trader sentiment and the balance between buying and selling pressure. By monitoring momentum shifts, traders gain a better understanding of when trends are losing strength and when the market may change direction, supporting more informed and strategic decision-making.
In conclusion, RSI divergence is an essential concept for traders seeking to anticipate trend reversals in the stock market. Bullish divergence signals potential upward movement, while bearish divergence indicates potential downward movement. By combining RSI divergence with other technical analysis tools, traders can identify momentum shifts, make timely trading decisions, and improve risk management in dynamic market conditions.