Understanding Support and Resistance Calculation for Effective Trading
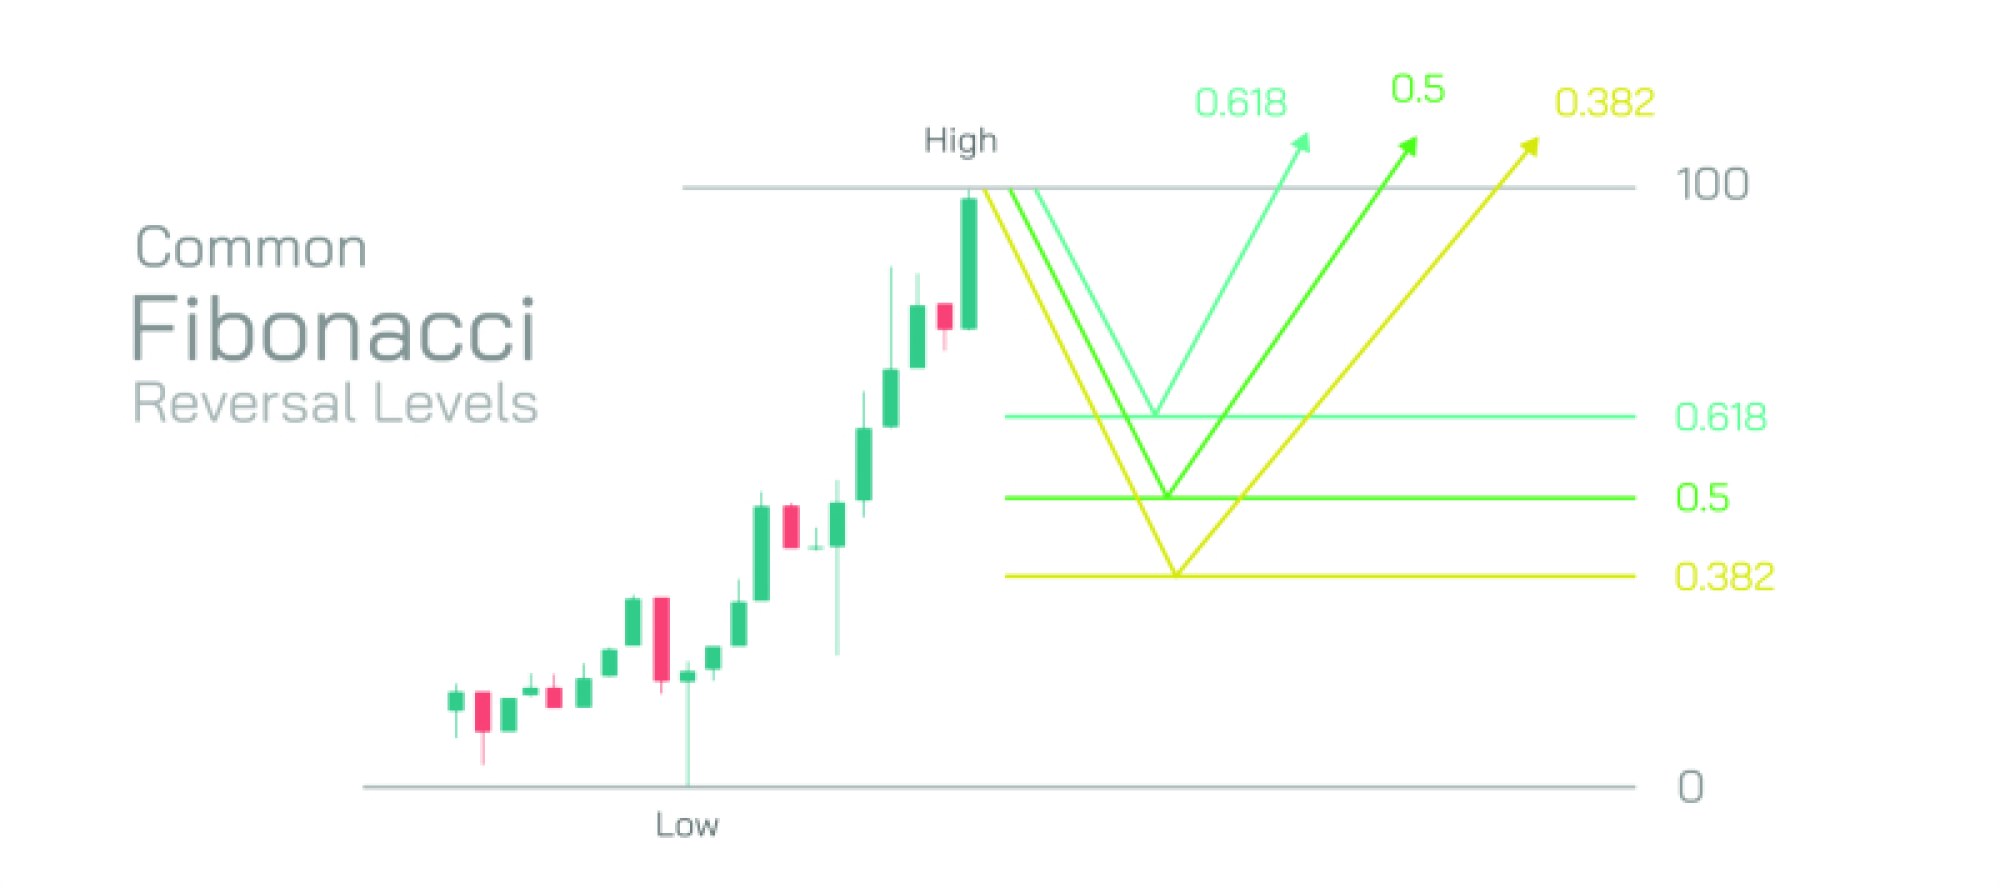
In stock trading, support and resistance levels are fundamental concepts that help traders identify potential price turning points, manage risk, and make informed trading decisions. Support represents a price level where buying interest is strong enough to prevent further declines, while resistance indicates a price zone where selling pressure prevents prices from rising further. Calculating these levels accurately is crucial for determining entry, exit, and stop-loss points across multiple trading strategies.
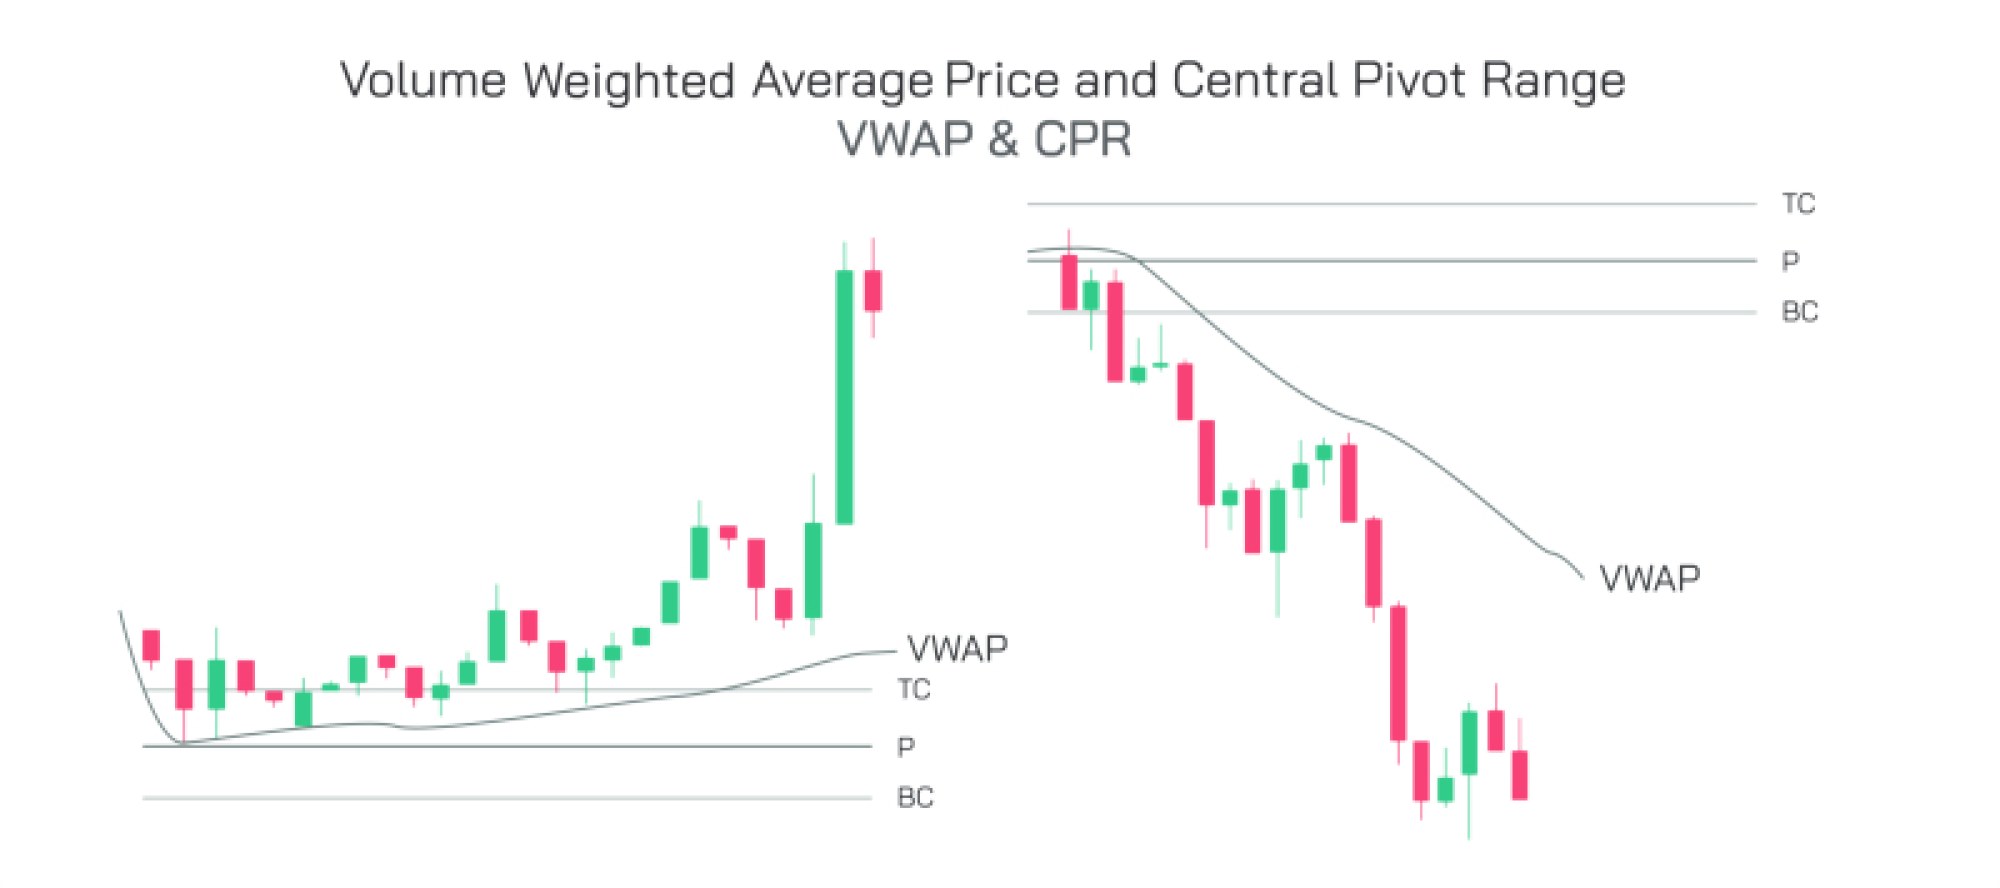
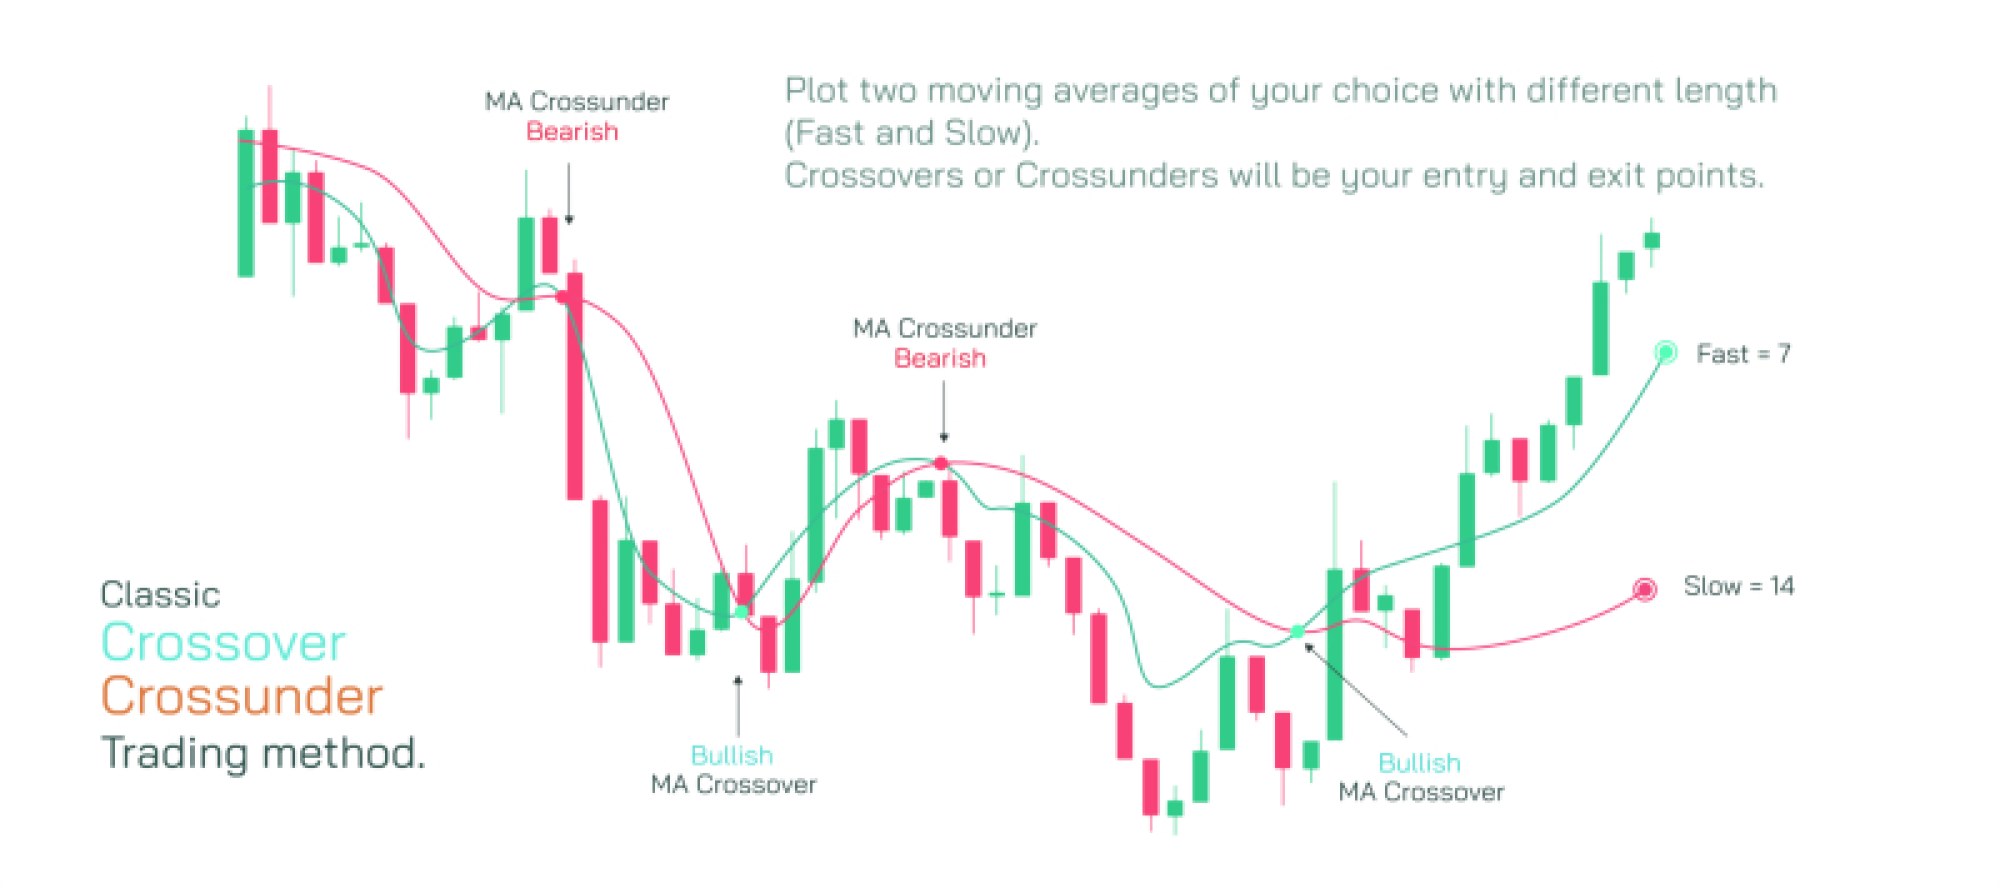
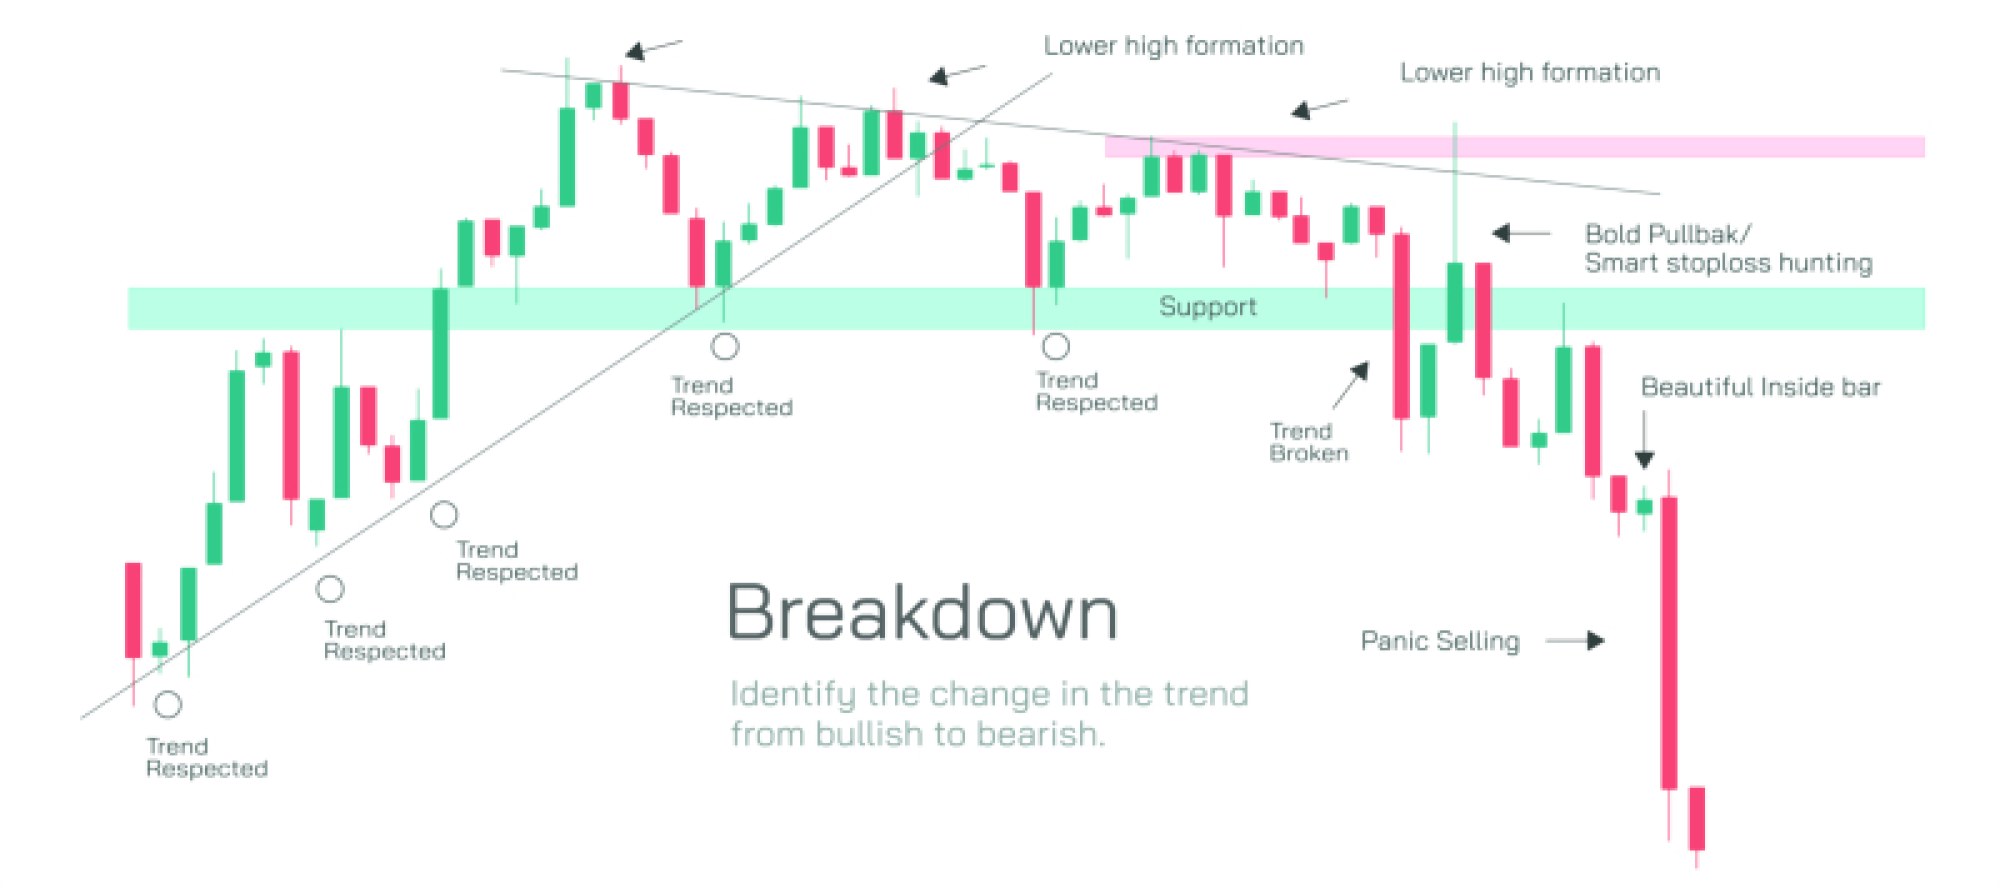
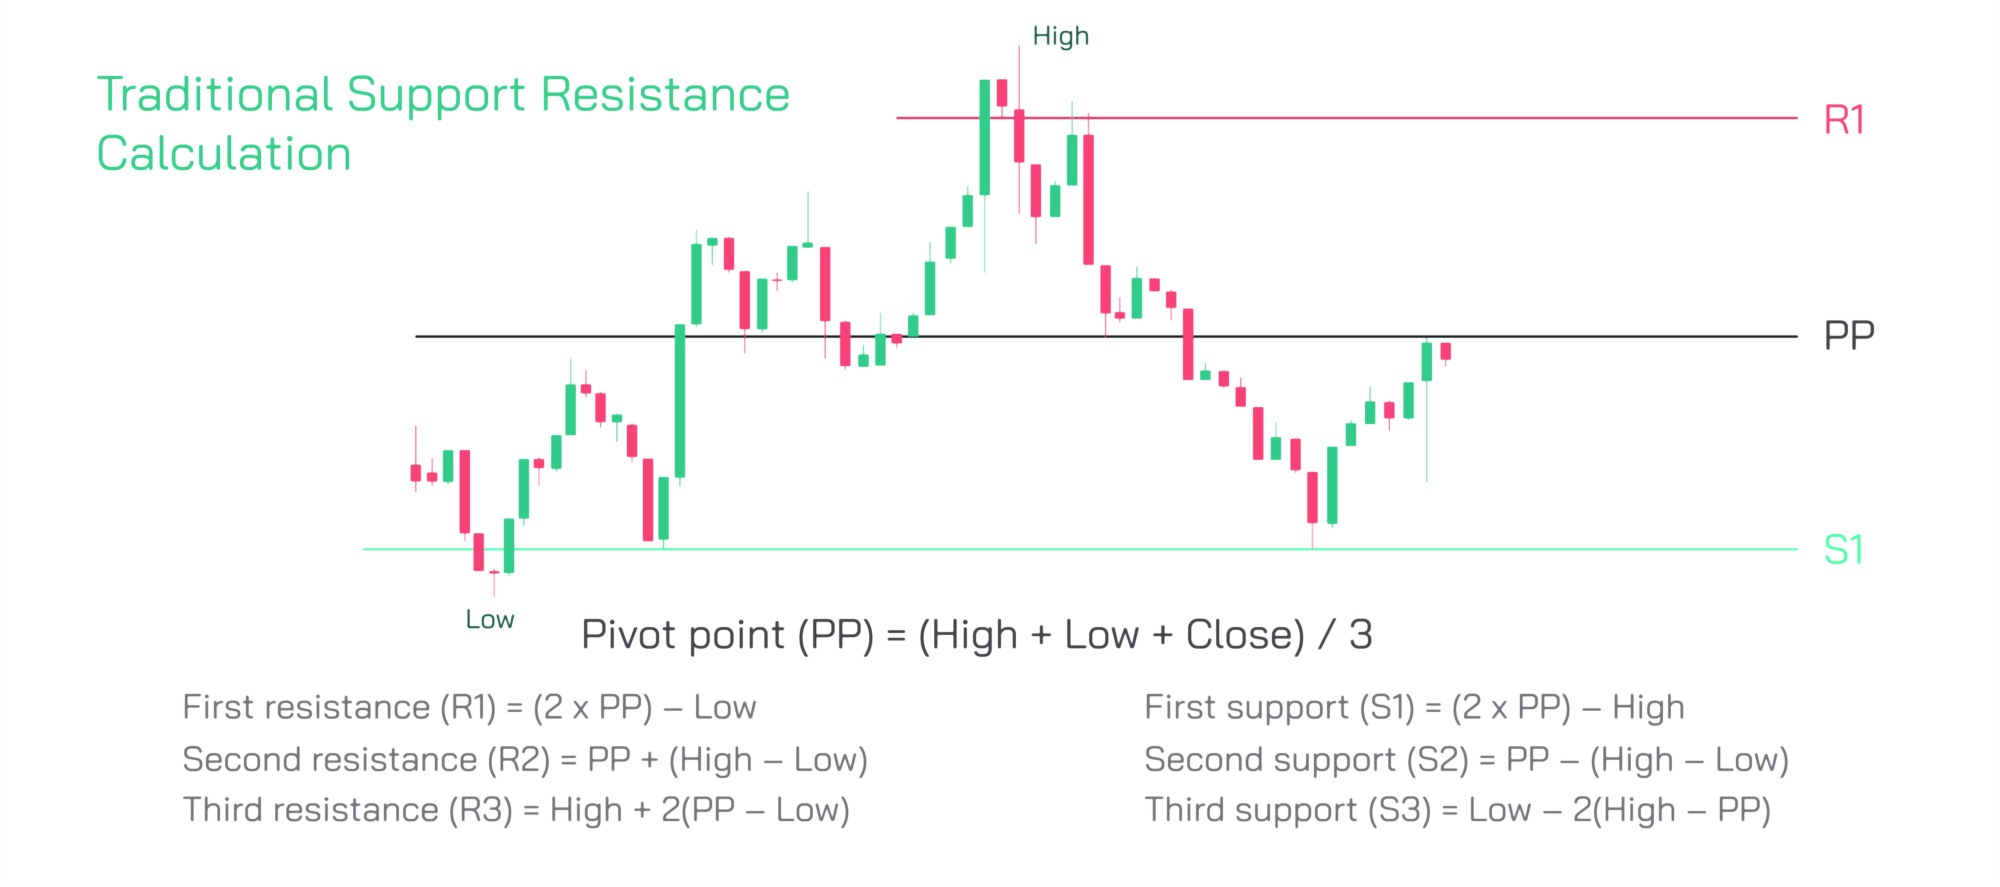
There are several widely used methods to calculate support and resistance. Pivot points are a popular tool that derives key levels from the previous period’s high, low, and close prices, providing predictable support and resistance zones for intraday and swing traders. Trendline analysis involves connecting consecutive lows or highs on a chart to identify dynamic support and resistance areas, reflecting the market’s direction and momentum. Another effective method is using moving averages, which act as dynamic support or resistance based on the average price over a selected timeframe, helping traders follow trends and anticipate reversals.
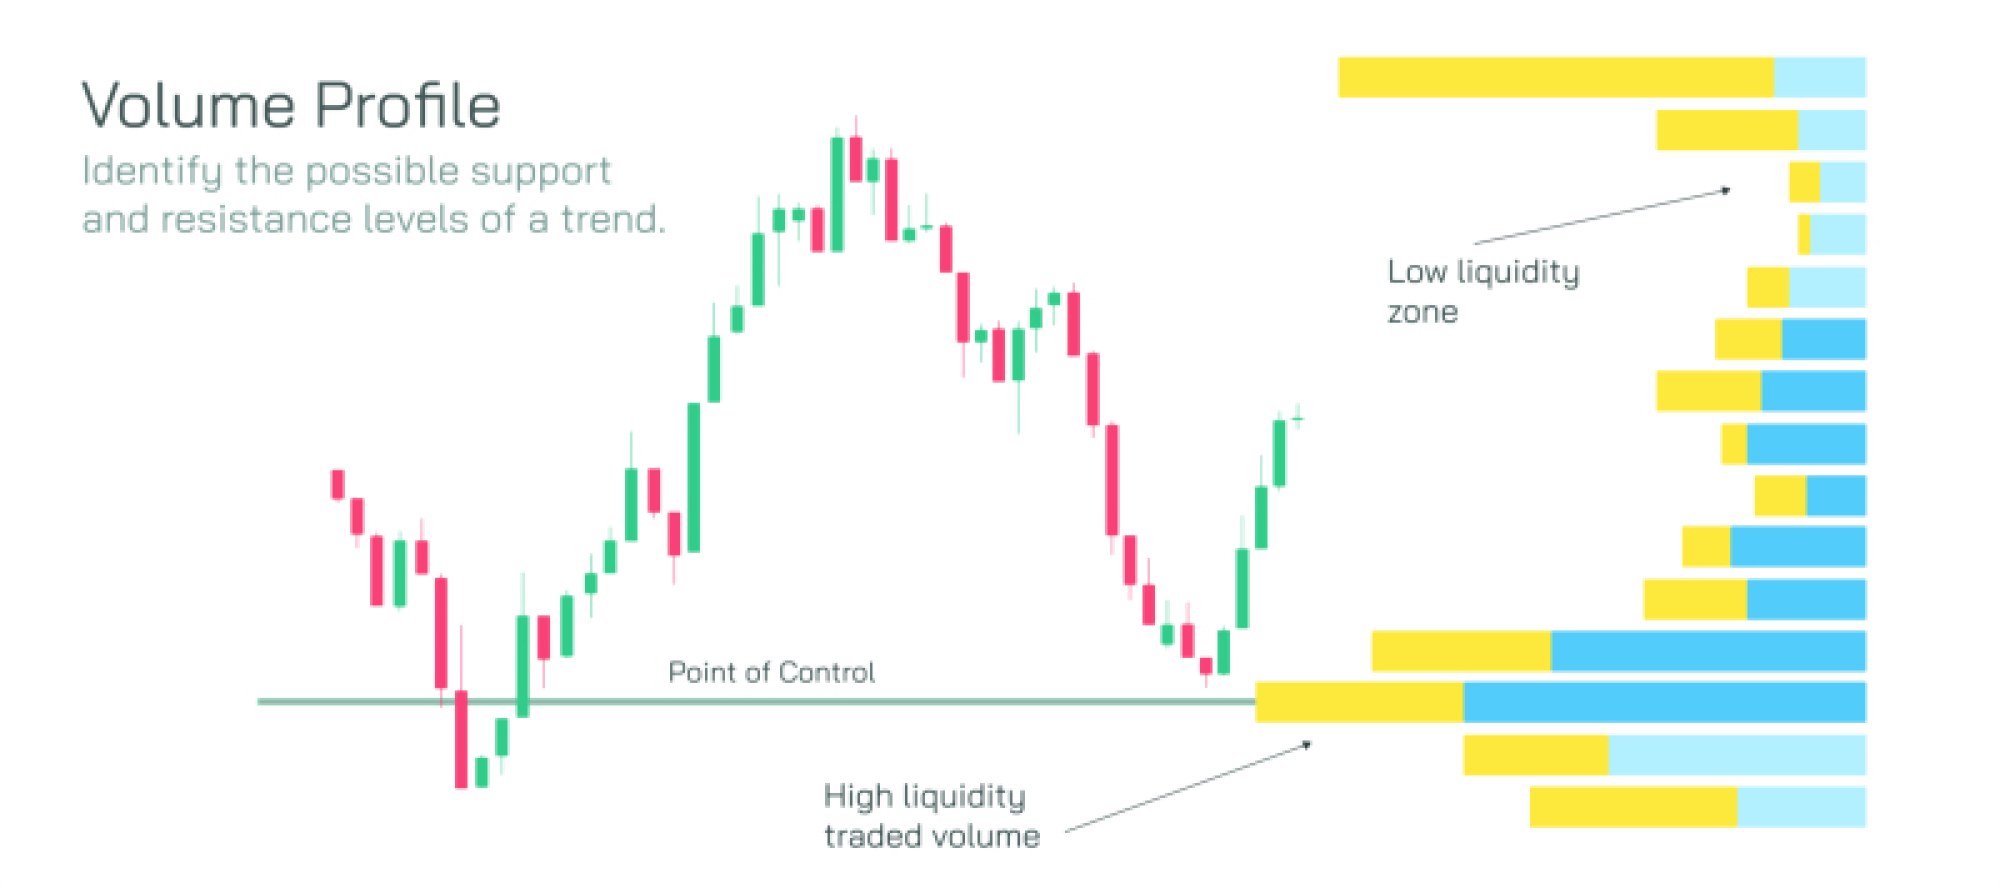
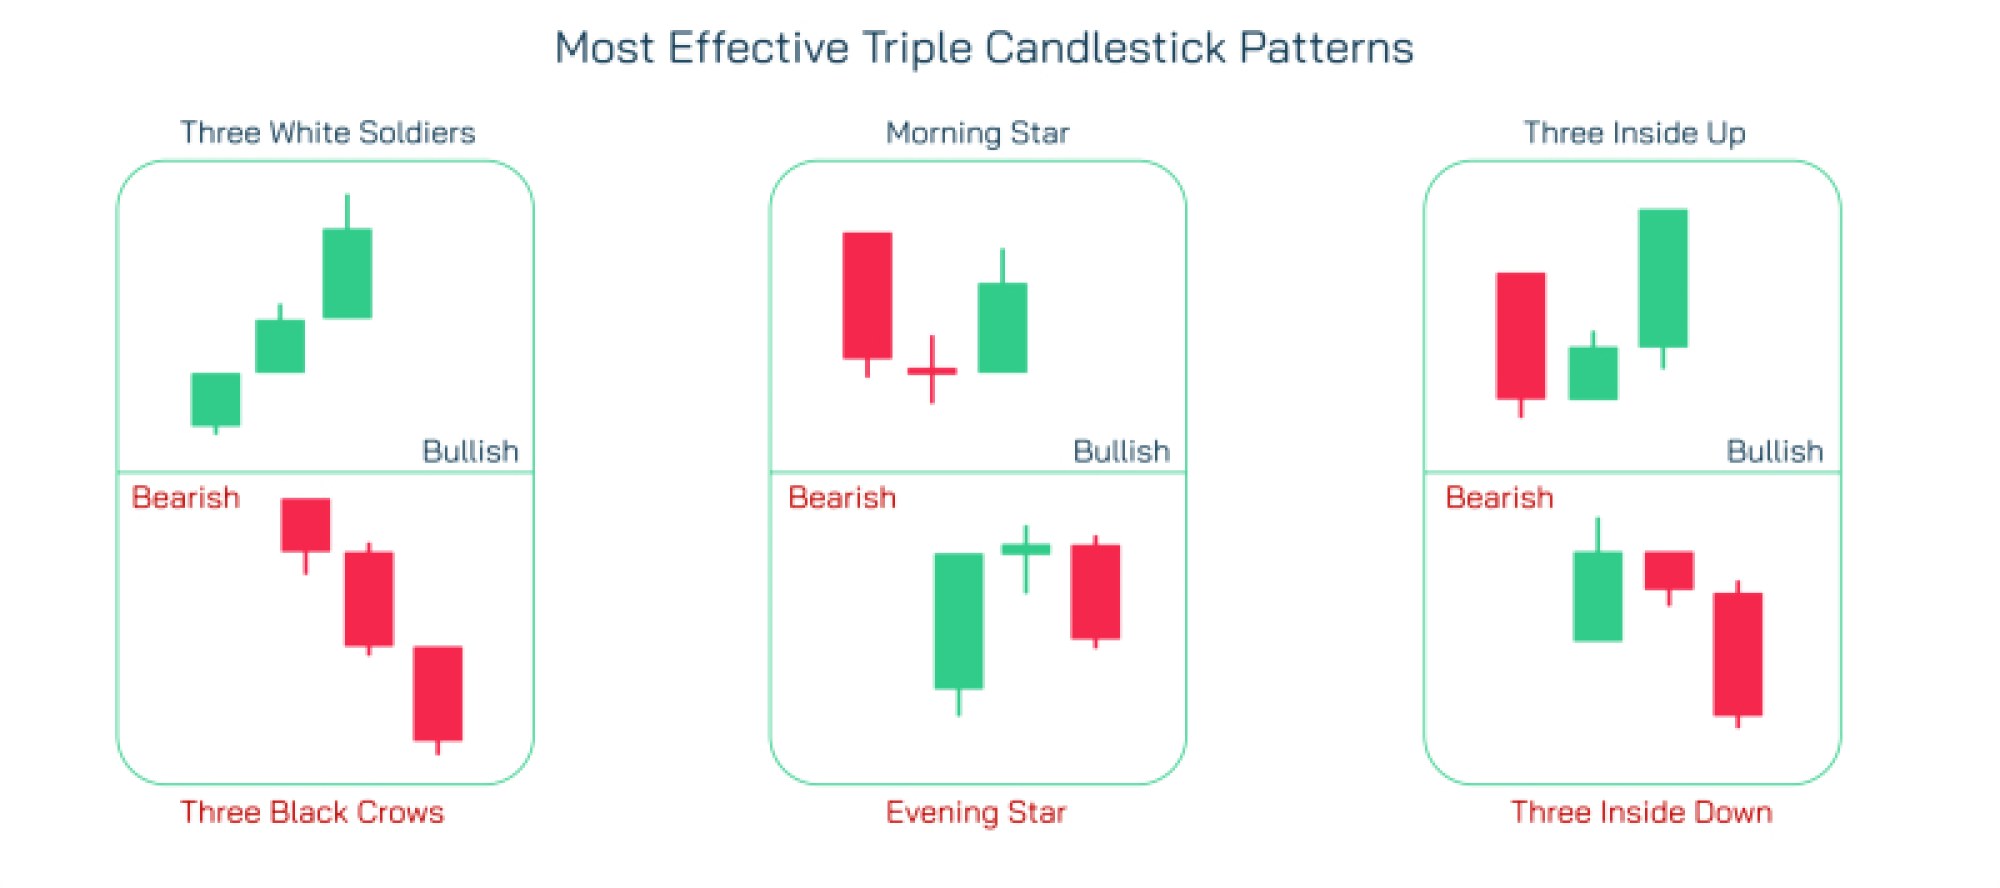
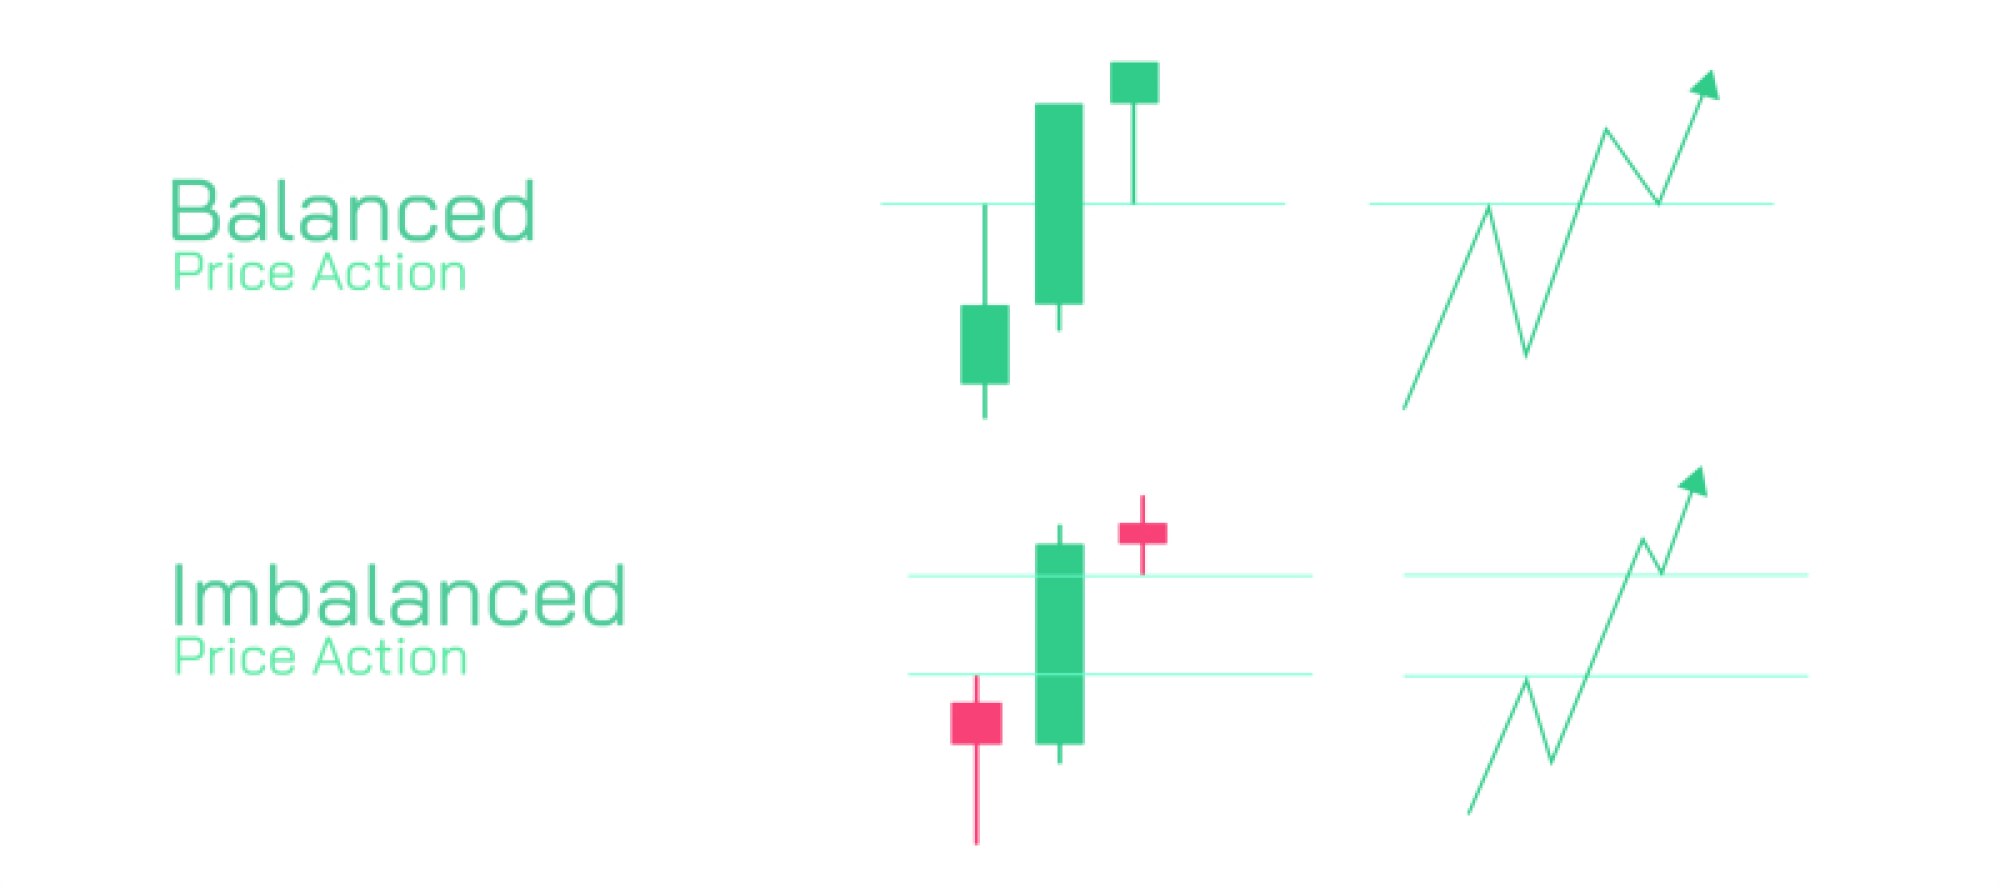
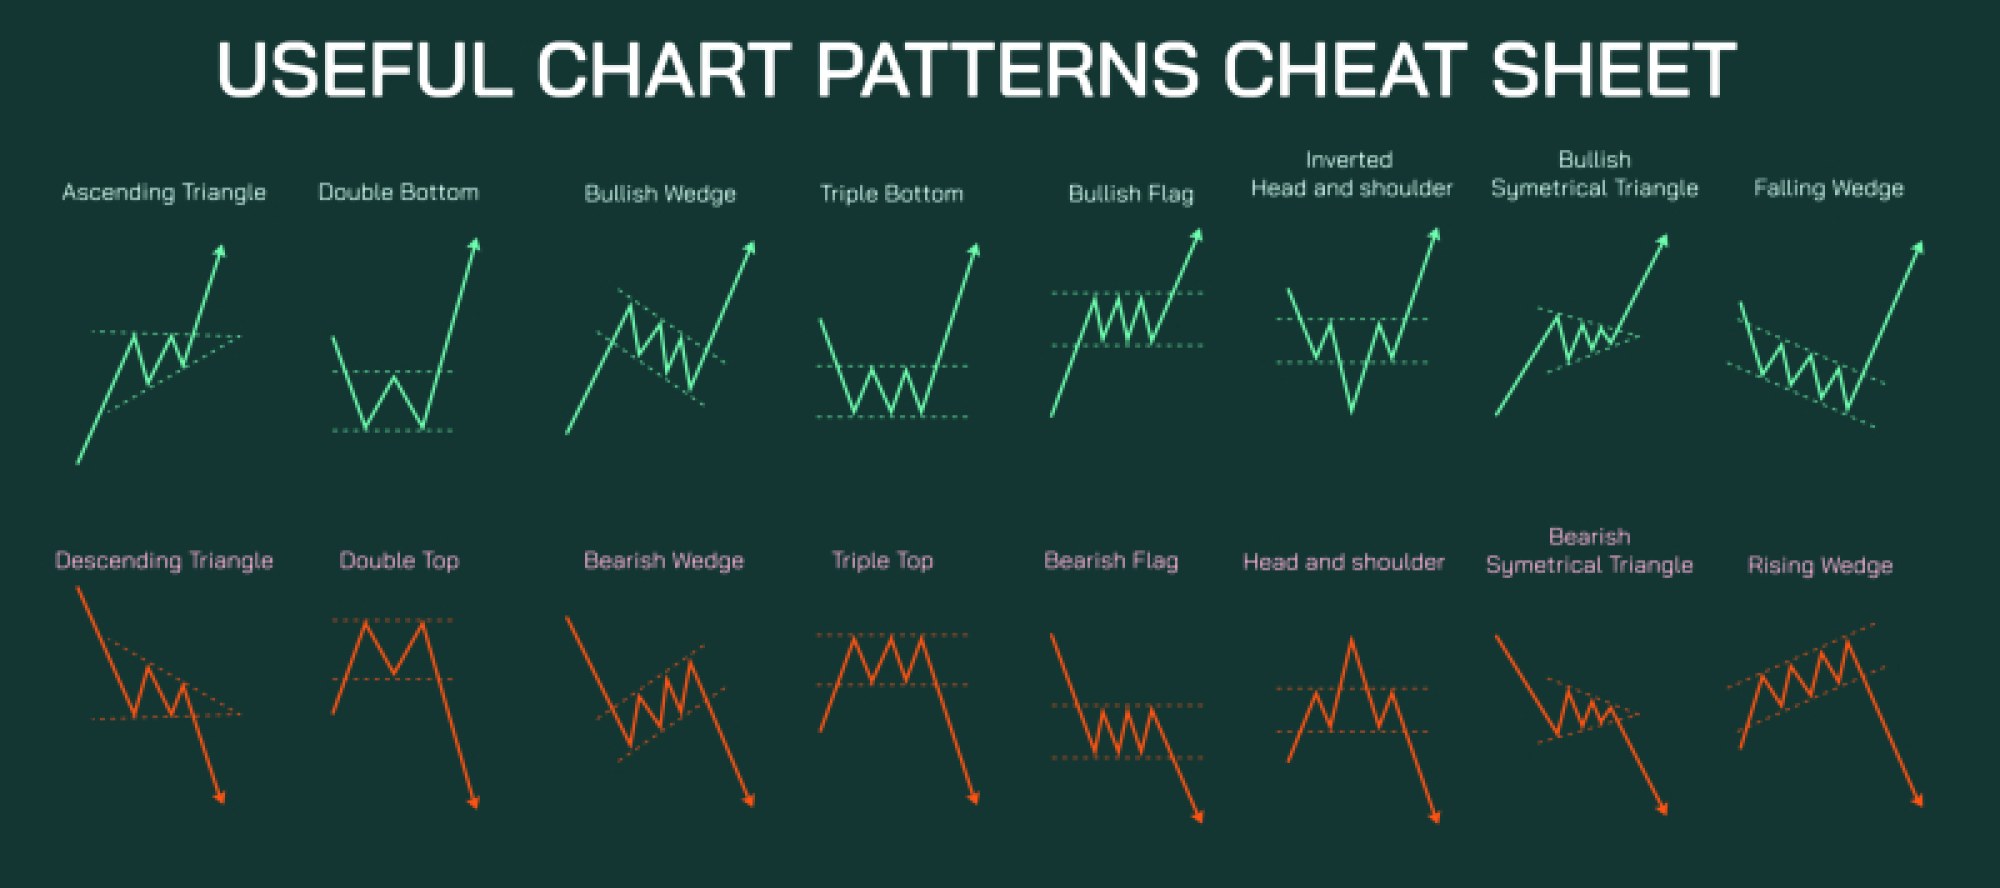
Volume analysis also enhances the accuracy of support and resistance calculation. High trading volumes at certain price levels indicate strong supply or demand, reinforcing the importance of these zones. Candlestick patterns and chart formations further complement the calculation, providing insights into market sentiment and potential breakout or reversal points. By combining these methods, traders can create high-probability trading setups, plan entries and exits, and define stop-loss levels effectively.
Support and resistance calculation is not only a tool for technical analysis but also a framework for risk management and strategic trading. Properly identifying these levels helps traders avoid overpaying in bullish markets or selling prematurely during pullbacks, optimizing profitability and reducing emotional decision-making. Moreover, these calculations are applicable across different trading styles, including intraday, swing, and long-term investing, making them versatile tools for professional market participants.
In conclusion, mastering support and resistance calculation empowers traders to navigate financial markets with precision and confidence. Accurate identification of these levels enhances trade planning, trend analysis, and market timing, enabling traders to capitalize on price movements while managing risk efficiently. By integrating technical indicators, volume analysis, and trend evaluation, support and resistance calculation becomes an essential element of any disciplined and successful trading strategy.