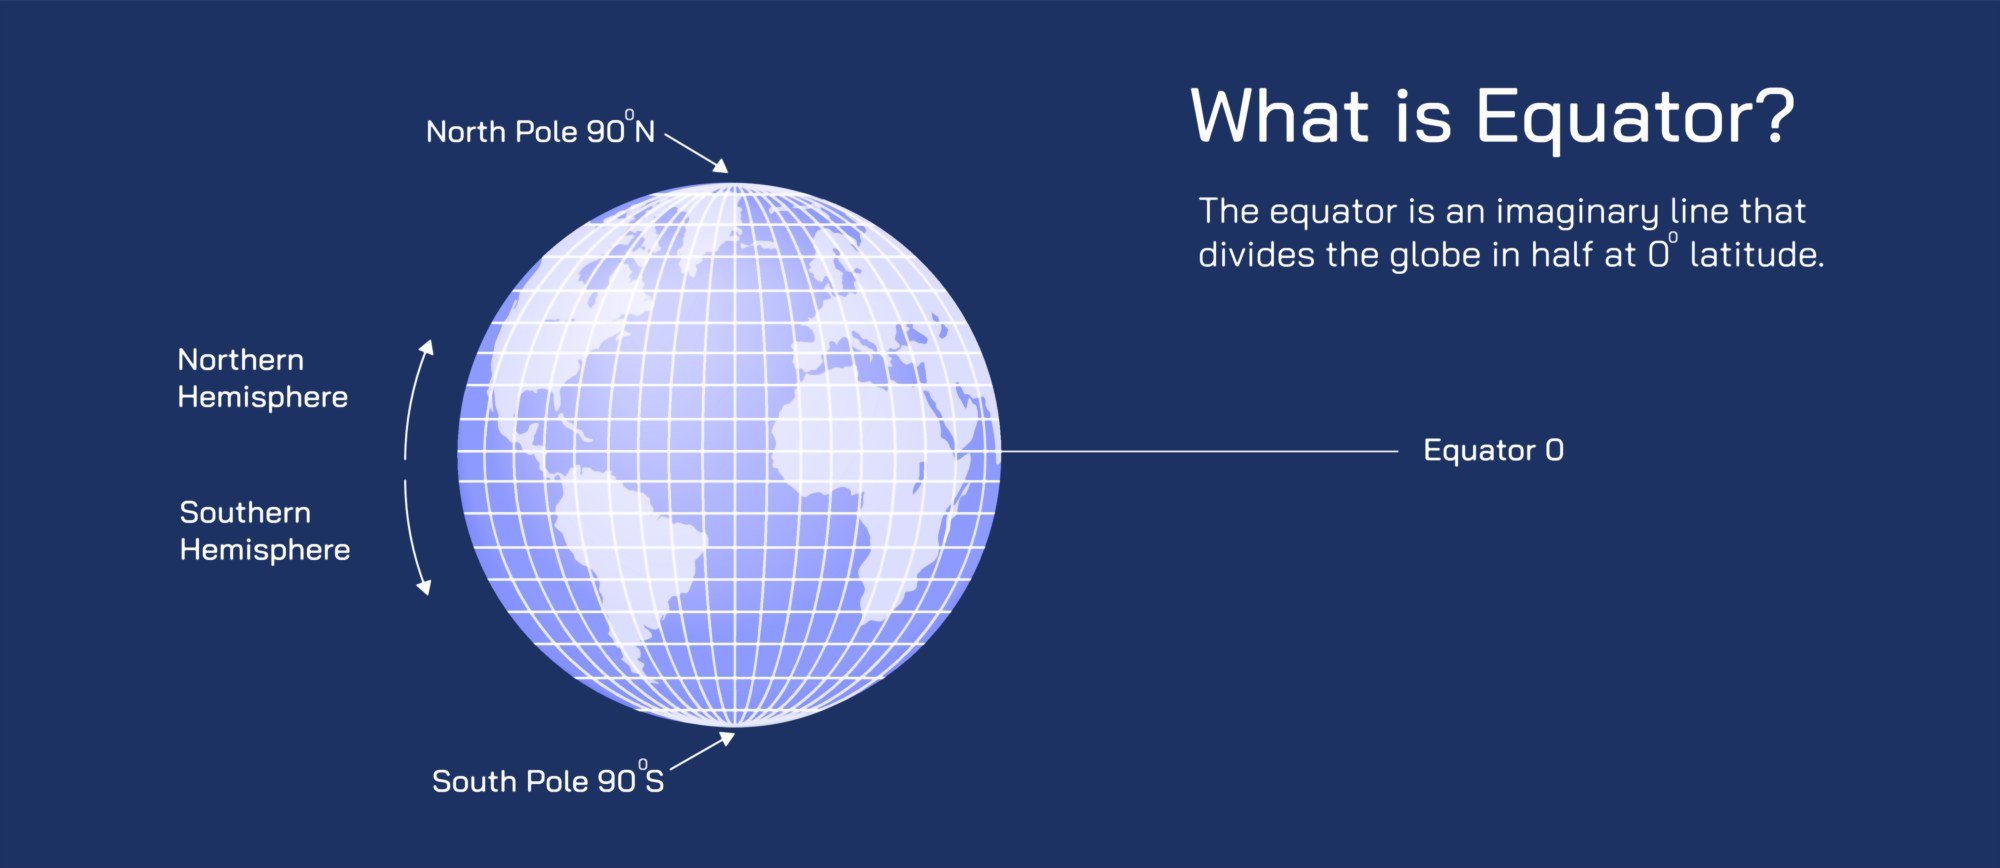
Equator Illustration: Earth’s Latitude, Climate Zones, and Global Geography Explained
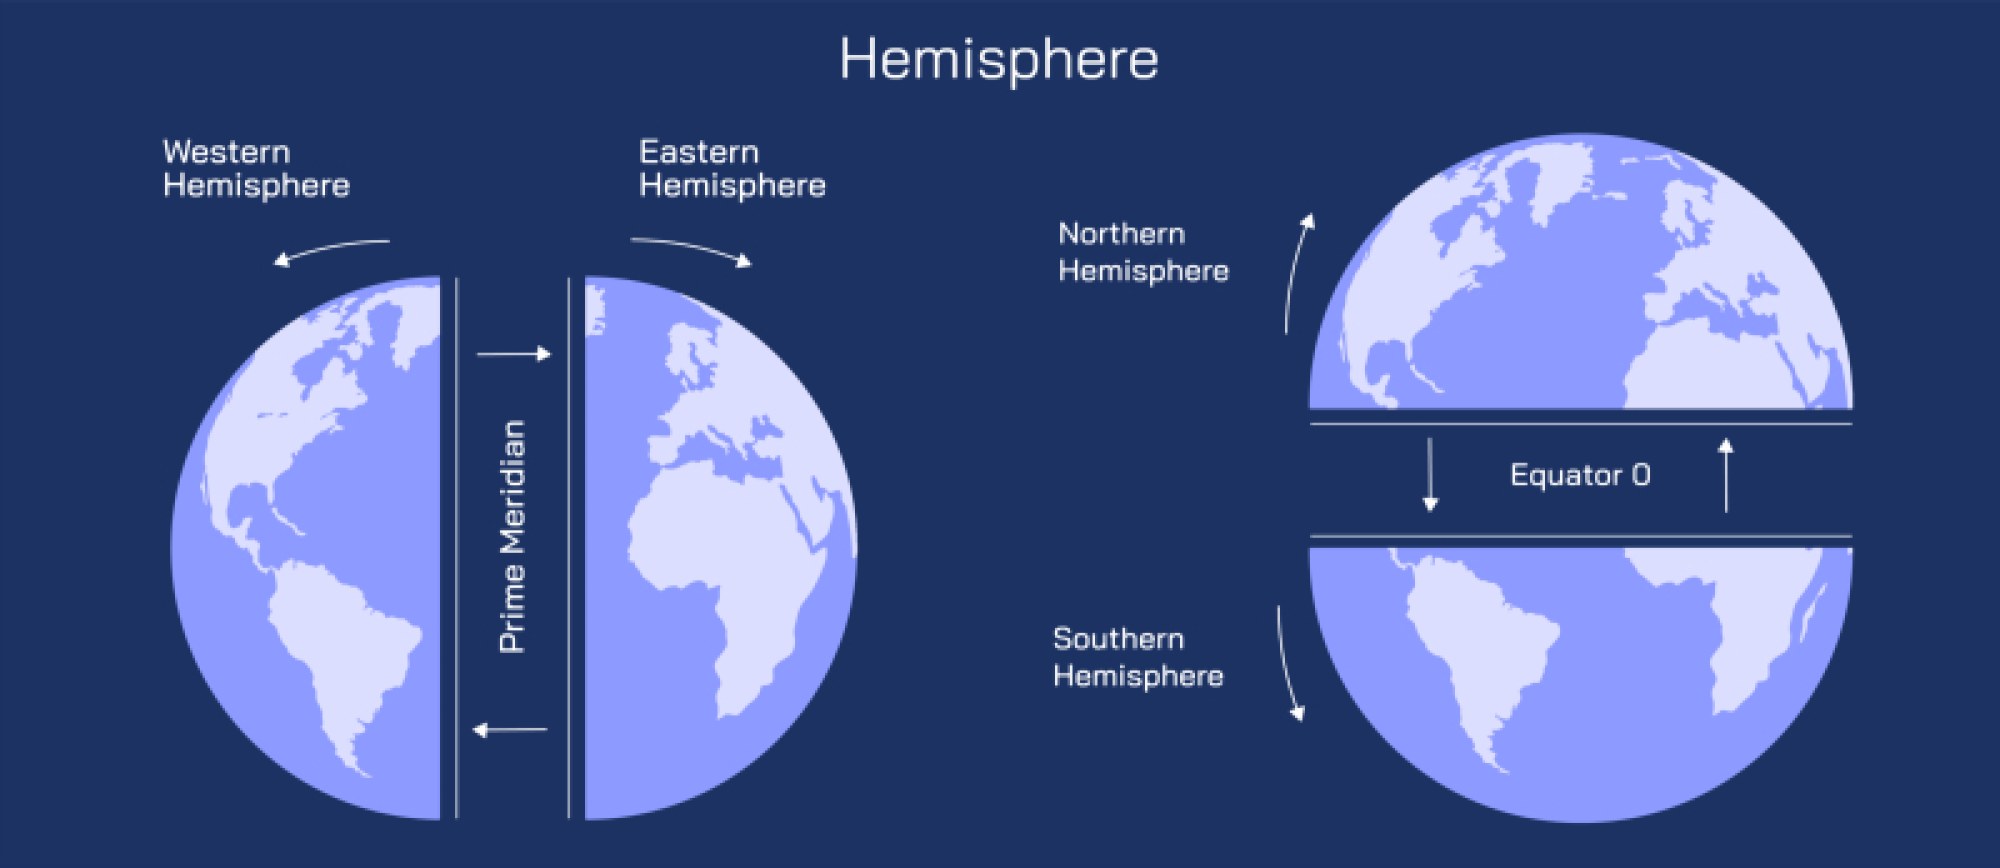
The equator is one of the most meaningful reference lines on Earth, not just as a geographic boundary but as a defining feature of global climate, ecological patterns, and seasonal rhythms. When illustrated on a globe, the equator appears as a horizontal circle around the widest part of the planet, dividing Earth into the Northern and Southern Hemispheres at latitude 0°. Although visually simple—a single line encircling the middle of the world—this imaginary boundary represents the point on Earth that receives the most direct sunlight year-round. Because the equator sits perpendicular to the axis of Earth’s tilt, solar rays strike it more vertically than at higher latitudes. A properly designed illustration often shows the angle of sunlight hitting the equatorial region in straight, near-overhead rays, while the same diagram shows sunlight reaching the poles at a low, slanted angle. This contrast reflects the fundamental geographic reality that the equator receives concentrated solar heating, and the poles receive diluted solar energy spread over a larger area. As a result, the equator serves as the thermal engine of the planet, and this energy input influences air movement, ocean circulation, and climate stability globally.
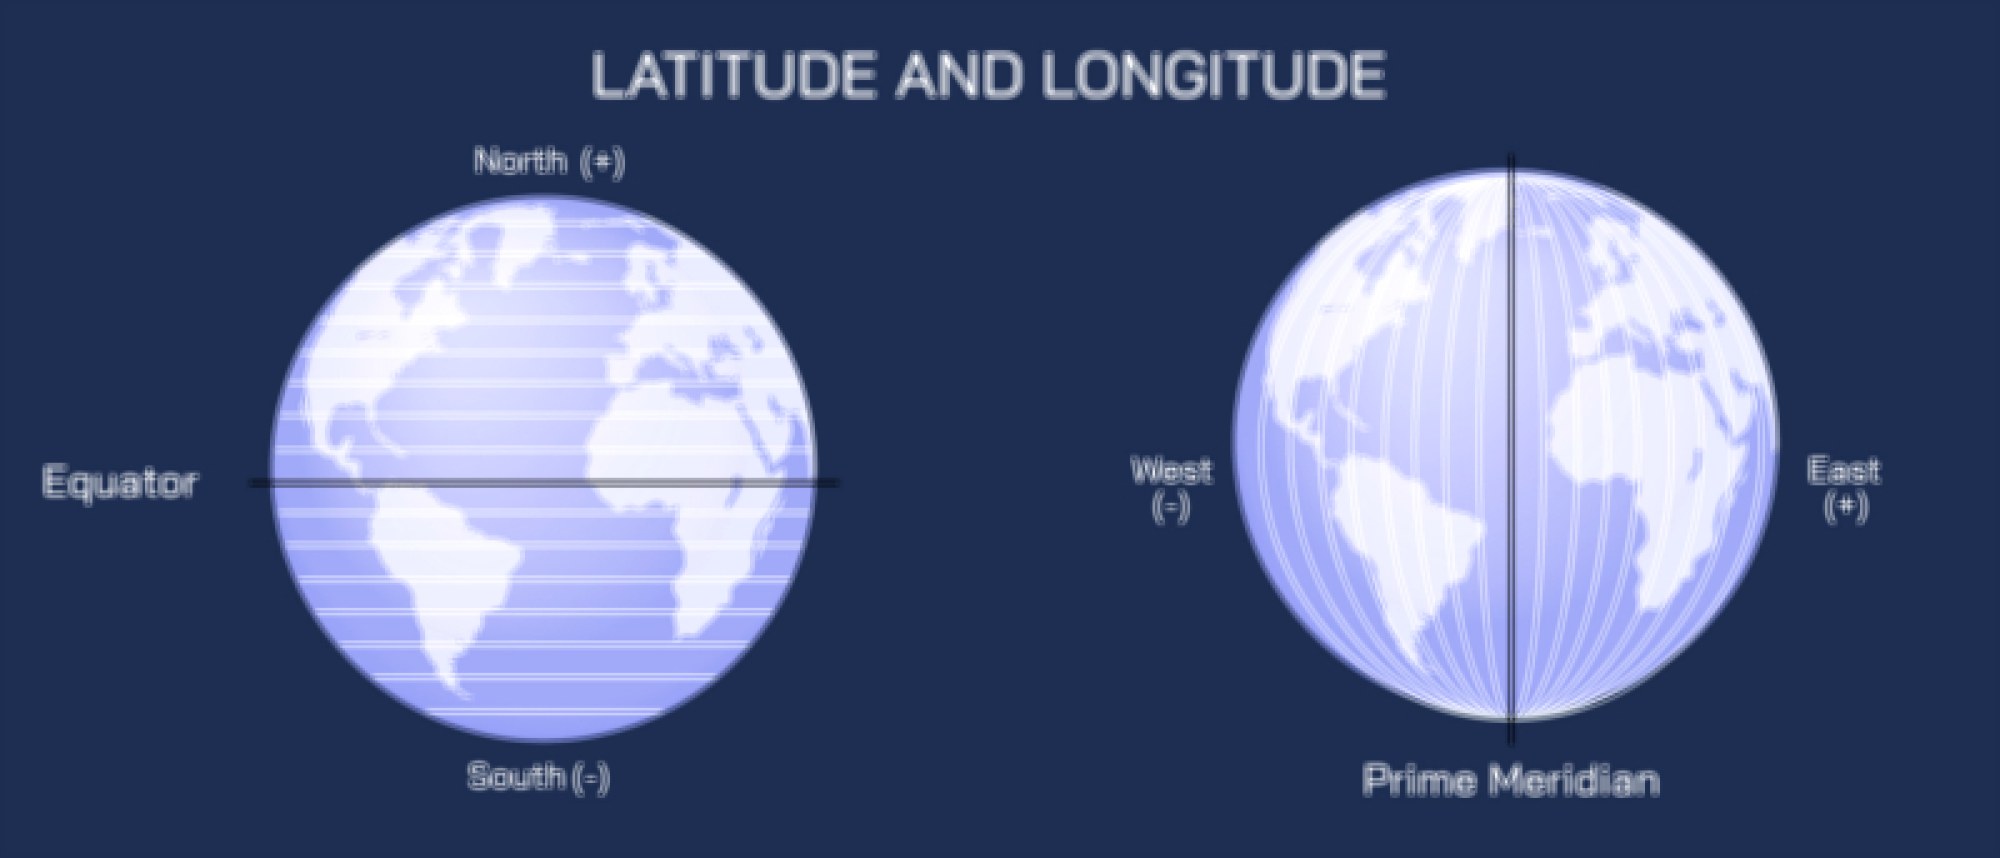
When the equator is viewed in the context of latitude, illustrations frequently include the coordinate grid system used by geographers. Latitude lines appear as horizontal circles running parallel to the equator, shrinking gradually toward the poles, with the equator being the largest circle of all. Because latitude determines exposure to sunlight, maps and diagrams often color the equatorial zone in warm tones representing high solar energy and stable temperatures while cooler shades gradually appear toward the polar regions. This visual coding helps explain why the equator acts as the reference line for defining Earth’s climate zones. The tropics—the region extending roughly 23.5° north to the Tropic of Cancer and 23.5° south to the Tropic of Capricorn—surround the equator and represent the warmest climatic band on the planet. Illustrations showing the Sun’s overhead position during solstices and equinoxes demonstrate that the Sun is directly overhead only in the tropics, never beyond them, which explains why low-latitude regions experience intense warmth and limited variation in seasonal temperatures compared to temperate and polar regions.
Climate zone illustrations linked to the equator provide some of the clearest visual examples of how geography shapes vegetation, weather, and ecosystems. Because the equator receives abundant heat and strong solar radiation, warm air rises constantly above equatorial regions and creates a low-pressure belt known as the Intertropical Convergence Zone (ITCZ). Diagrams often show trade winds from the Northern and Southern Hemispheres converging at the equator, forcing moist air upward where it cools and produces cloud formation. This consistent upward circulation results in frequent convectional rainfall, giving rise to the world’s largest and most biologically diverse rainforests. In geographic illustrations, the Amazon Basin in South America, the Congo Basin in Central Africa, and large rainforest areas across Southeast Asia stand out as broad, deep-green belts straddling the equator. These zones serve as tangible reminders that the equator is not merely a coordinate but a generator of life-sustaining climate conditions.
Because the equator receives steady solar heating and minimal seasonal variation, temperature remains relatively constant throughout the year, and seasonal differences are defined more by rainfall than by temperature. Illustrations comparing temperate and equatorial seasonal graphs often show sinusoidal temperature curves in mid-latitudes but nearly flat temperature lines at the equator paired with alternating wet and dry periods. This pattern explains why equatorial regions typically feature ecosystems such as rainforests, tropical savannas, and mangroves rather than the forests or grasslands commonly associated with temperate climates. Moreover, some equatorial regions lie near cool ocean currents, which may modify humidity and create unique climatic variations that illustrations depict by showing shifting ocean currents and regional vegetation types along the equatorial belt.
Another important aspect commonly included in equator illustrations is the Earth’s tilt, which is the reason seasons change but equatorial regions remain relatively stable. Earth is tilted about 23.5° relative to its orbital plane, and illustrations frequently portray this tilt with the Sun positioned overhead at different times of the year. The equinoxes—when the Sun crosses the equator—are marked by equal day and night lengths across the entire planet. Diagrams depicting the path of sunlight during equinoxes show the whole globe evenly illuminated, emphasizing the special role of the equator as the center point of solar symmetry. In contrast, solstice diagrams show the Sun positioned directly over the Tropic of Cancer or the Tropic of Capricorn, explaining why daylight hours vary drastically at higher latitudes while remaining nearly constant at the equator.
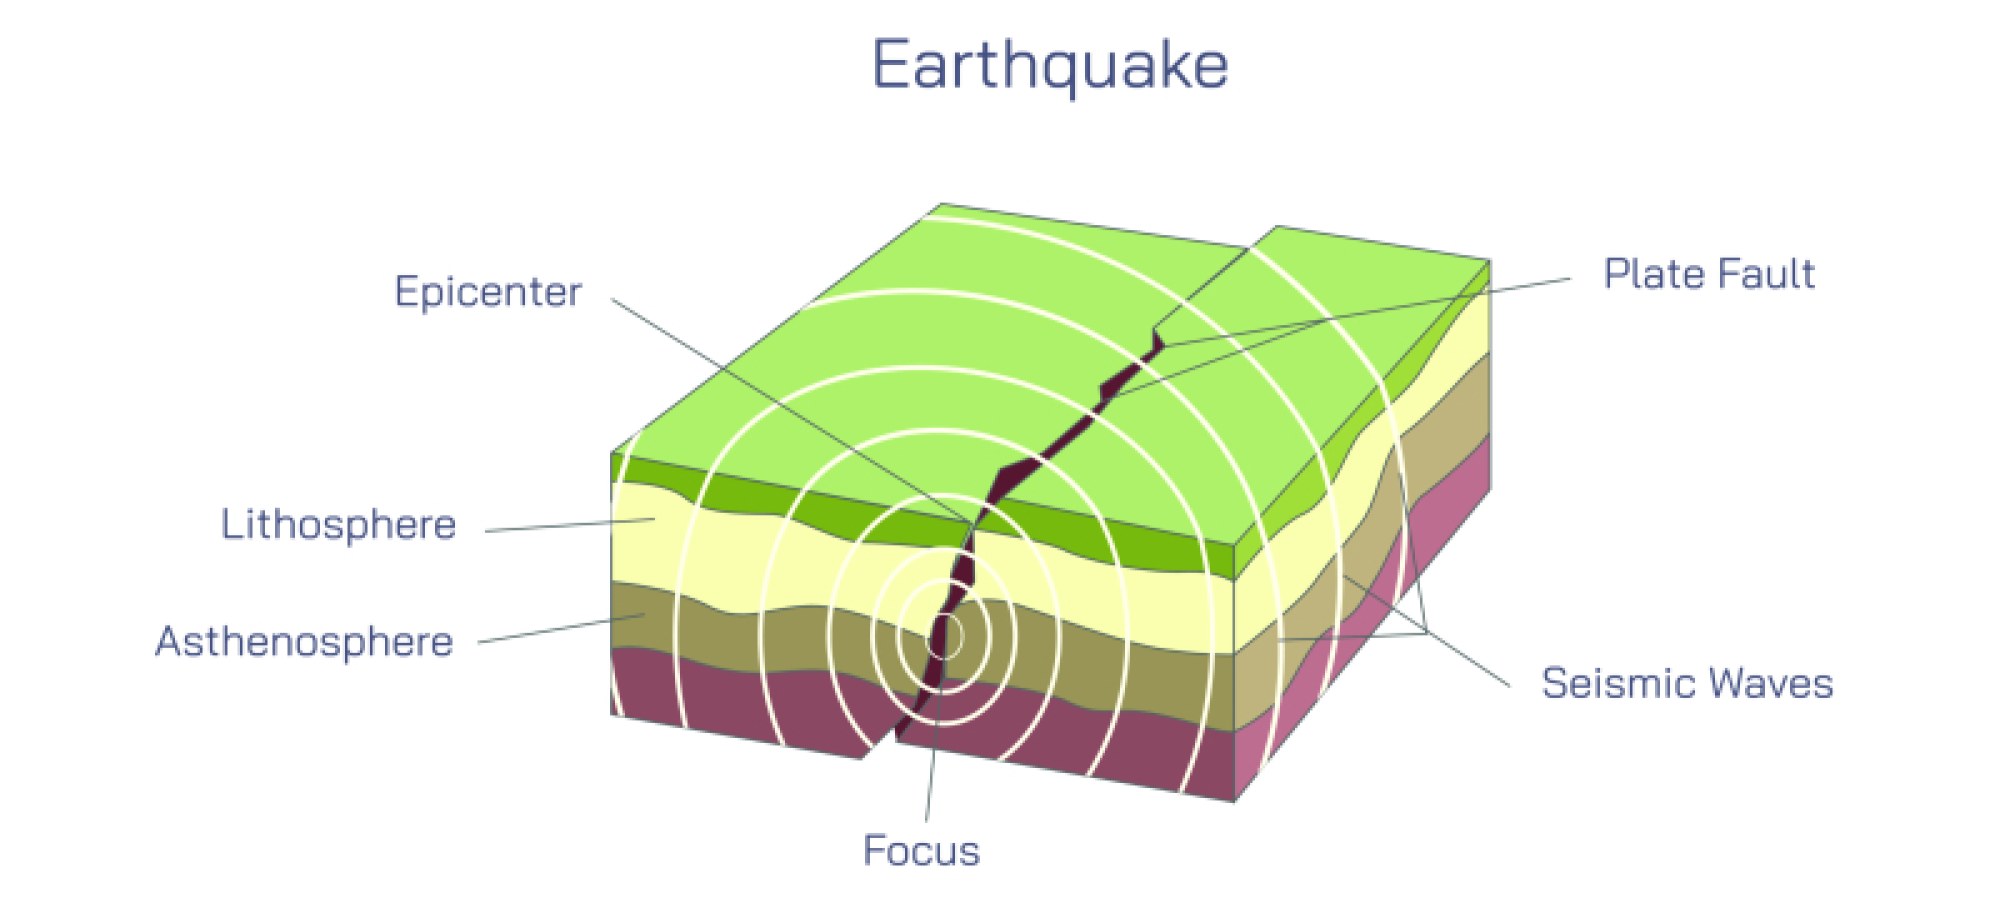
Maps that highlight plate tectonics and land distribution also reveal distinctive features of equatorial geography. Six continents—South America, Africa, Asia, Australia, and island regions of Oceania—include territory that crosses or borders the equator. Africa is the most centrally positioned across both hemispheres, and this geographic placement helps explain the enormous ecological variation that spans from the Sahara Desert north of the equator to lush rainforests in the center of the continent and drier savannas to the south. Illustrations tracing tectonic plates show that the equator passes through dynamic geological areas including volcanic island chains and active fault zones, demonstrating that equatorial environments are shaped not just by climate but by long-term geologic forces.
The equator also plays a valuable role in understanding global wind systems and ocean currents. Because rising warm air near the equator creates low pressure, air must move from higher-pressure zones toward the equator. This flow, combined with Earth’s rotation, gives rise to the trade winds—a major component of global circulation. Equatorial diagrams often show wind arrows curving westward, illustrating the Coriolis effect, which is responsible for the deflection of moving air and ocean currents. Warm equatorial currents flow westward across oceans and transfer heat toward higher latitudes, while cool deep-ocean return currents travel back toward the equator. This circulation redistributes heat and stabilizes global temperature patterns. Without the equator supplying heat and influencing global circulation, seasonal rhythms and planetary climate would be drastically different.
In cultural and human geography, illustrations of the equator help explain global timekeeping, navigation, and population distribution. Historically, determining accurate latitude—including calculating proximity to the equator—was essential for maritime travel and mapmaking. Modern maps and satellite images show that major population centers lie predominantly in the temperate zones rather than directly on the equator, but equatorial countries support rich cultural diversity and economic activity tied closely to natural resources. Many equatorial regions are leading producers of crops such as coffee, cacao, bananas, coconuts, and palm oil because year-round warm temperatures and seasonal rainfall cycles provide ideal agricultural conditions. Illustrations showing agricultural belts, trade routes, and ecosystem maps emphasize the interplay between equatorial climate, soil fertility, and human settlement patterns.
Because the equator intersects multiple nations, many equatorial landmarks mark the line for cultural and educational purposes. Monuments in Ecuador, Kenya, Uganda, Indonesia, São Tomé and Príncipe, and Brazil commemorate the exact latitude of 0°, and several illustrations show how objects behave differently on either side of the line, although myths sometimes exaggerate the effects of the Coriolis force at local scales. In science museums, rotating fluid demonstrations are often used to show how global Coriolis patterns depend on large-scale circulation rather than small localized experiments, reinforcing the idea that the equator’s influence is global, not merely local.
The celestial equator, often included in astronomical illustrations, shows how Earth’s equator extends conceptually into space. When projected outward, it forms an imaginary circle on the celestial sphere that astronomers use to map the positions of stars and planets. Diagrams of the celestial coordinate system display the celestial equator alongside the ecliptic—the plane of Earth’s orbit around the Sun—helping explain how seasonal star patterns shift and why certain constellations appear only in one hemisphere. Thus, the equator influences not only earthly geography and climate but also navigation and mapping in the wider universe.
Ultimately, an illustration of the equator encapsulates more than a geographic boundary. It visually expresses the organizing principles of Earth’s physical environment—how solar energy is distributed, how climate zones form, how weather and ocean circulation operate, how ecosystems develop, and how human societies adapt to the largest energy-driven forces of the planet. Through a single continuous line around the middle of Earth, a viewer can trace the origins of temperature gradients, rainfall patterns, wind belts, biodiversity distribution, agricultural opportunity, and even celestial navigation. The equator stands not just as a cartographic feature but as a visual and conceptual anchor for understanding the interconnected systems that shape the world.