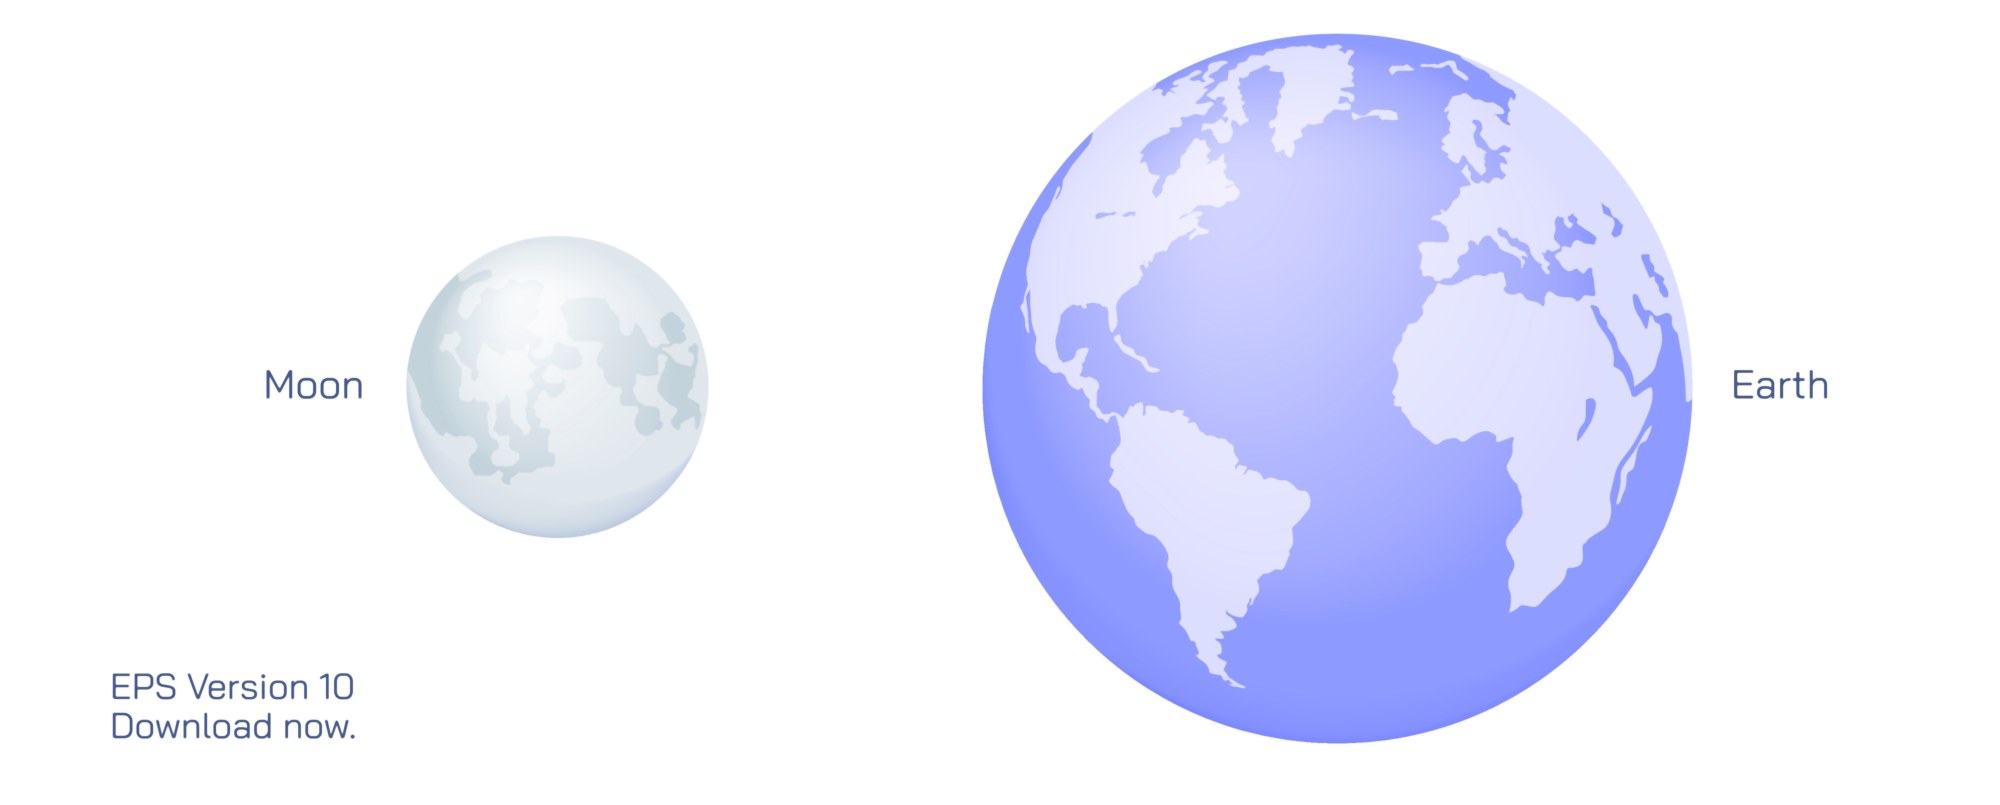
Moon and Earth Vector Illustration: Orbital Relationship, Phases, and Scale Explained
The dynamic relationship between the Moon and Earth becomes far more intuitive when presented in a clear vector illustration that maps how the Moon orbits our planet, how lunar phases occur, and how the relative scale of both bodies and their distances shape what we see from Earth. Although the Moon appears close and bright in the sky, the geometry of its orbit and illumination involves multiple layers of motion, perspective, and size—concepts that become immediately understandable once translated into clean diagrams.
At the core of such an illustration is the orbital path of the Moon around Earth. The Moon follows an elliptical orbit with an average distance of roughly 384,400 km, and vector diagrams typically show Earth at the center with the Moon traveling counterclockwise when viewed from above the North Pole. Small size variations along the path may be labeled to show perigee (closest point) and apogee (farthest point). Though simplified in most depictions, this elliptical path reflects why the Moon appears slightly larger at perigee and smaller at apogee. Many diagrams also add arrow indicators to show the orbital period of 27.3 days, which represents the Moon’s sidereal orbit relative to the stars, and the longer 29.5-day synodic cycle, which governs the progression of the lunar phases.
One of the most visually striking elements of the illustration involves the Moon’s phases, which occur because the Moon always keeps the same side facing Earth while sunlight illuminates different portions of its surface. To demonstrate this, vector artwork usually places the Sun on one side of the layout, radiating light toward both Earth and the Moon. The orbital path is then populated with Moon icons at different angular positions relative to Earth and the Sun. Each icon displays only the visible illuminated fraction. This ring of phase depictions typically includes:
New Moon, directly between the Sun and Earth, where the side facing Earth is dark
Waxing Crescent, where illumination begins to grow
First Quarter, with the right half illuminated
Waxing Gibbous, almost fully illuminated
Full Moon, opposite the Sun, with the Earth-facing side fully lit
Waning Gibbous, shrinking illumination
Last (Third) Quarter, with the left half illuminated
Waning Crescent, leading back toward the New Moon
By placing these phases around the orbital circle, the illustration clarifies that the changing appearance of the Moon has nothing to do with Earth’s shadow but rather with the viewing angle of the Sun-Moon-Earth system.
Many diagrams also emphasize the Moon’s tidal locking, the reason we always see the same hemisphere. A small rotation indicator inside the orbital track often shows that the Moon rotates once per orbit relative to the stars, synchronizing its spin with its revolution. This highlights that the “near side” of the Moon constantly faces Earth while the “far side” remains hidden from direct view.
Another important aspect of a Moon-Earth vector illustration is relative scale, a concept difficult to grasp from naked-eye observation. Though artistic depictions often exaggerate sizes for clarity, a scientifically scaled version shows that:
Earth’s diameter is about 12,742 km
The Moon’s diameter is about 3,474 km, making it 27% the diameter of Earth
The distance between them is roughly 30 Earth diameters
To convey this scale, a vector illustration might place Earth and Moon at proportional sizes and then represent the distance using repeating Earth-width markers, making the surprising emptiness of space between them visually clear. When size and distance are illustrated accurately, viewers immediately understand why the Moon looks large in the night sky despite its relatively small diameter, and why gravitational interactions—though strong enough to drive ocean tides—are finely balanced.
Inclination is another key visual detail that may appear in more detailed diagrams. The Moon’s orbital plane is tilted by about 5 degrees relative to Earth’s orbital plane around the Sun. Side-view illustrations use slanted rings to show this tilt, making it evident why solar and lunar eclipses do not occur every month—the Moon usually passes slightly above or below the Earth-Sun plane rather than lining up perfectly for shadows to fall. When the alignment does occur, diagrams show:
A solar eclipse when the Moon passes directly between Earth and the Sun
A lunar eclipse when Earth casts its shadow on the Moon
These complementary eclipse visuals reinforce the significance of orbital geometry.
Some vector illustrations go further by integrating gravitational and tidal interactions. Arrows between Earth and the Moon may represent gravitational pull, and diagrams of Earth’s oceans show tidal bulges aligned toward and away from the Moon. These graphics visually connect the Moon’s mass to tidal cycles and rotational braking, hinting at Earth’s gradually lengthening day over long geologic time.
Together, these graphic elements—orbital motion, lunar phases, tides, scale, inclination, rotational locking, and eclipse conditions—paint a complete picture of the Moon-Earth system at a glance. Although each component represents complex celestial mechanics, a well-designed Moon-and-Earth vector illustration arranges them clearly enough that even newcomers can see how cycles, shadows, and orbital geometry determine what we witness from the ground. It transforms familiar nightly sights into a scientifically coherent system, revealing the elegance of celestial motion and the deep relationship between our planet and its only natural satellite.