Hubble’s Law and Lemaître’s Law Illustration: Universe Expansion and Redshift Explained
The expansion of the universe is one of the most profound discoveries of modern cosmology, and an illustration comparing Hubble’s Law and Lemaître’s Law brings clarity to how scientists realized that galaxies are moving away from one another and that the fabric of space itself is stretching over time. Although these principles now form a foundation of astrophysics, their visualization is essential for understanding the link between redshift, distance, and expansion. When the idea is translated into diagrams—showing galaxies drifting farther apart as the universe grows—it becomes easier to grasp how astronomers interpreted the light from distant galaxies as evidence of cosmic motion rather than a static, unchanging universe.
The origin of this insight lies in the work of Georges Lemaître, a Belgian physicist and priest, who proposed in 1927 that the universe is expanding and that more distant galaxies recede faster than closer ones. He formulated a mathematical relationship between recession velocity and distance, suggesting that the universe had once been smaller and must have originated in a dense, highly compressed state—what later became known as the Big Bang. Although Lemaître was first to express the expansion of the universe and relate it to astronomical observations, it was Edwin Hubble, using the Hooker Telescope at Mount Wilson Observatory, who provided observational evidence two years later. By measuring distances to galaxies and analyzing the shift in their spectral lines, Hubble constructed a graph that showed a clear correlation: the farther away a galaxy is, the faster it is moving away. In visual form, this became the celebrated Hubble–Lemaître relation, often summarized as a straight line on a scatter plot.
In most illustrations, Hubble’s Law = v = H₀·d appears as a trend line where distance lies along the horizontal axis and recession velocity along the vertical axis. Data points representing observed galaxies cluster around the upward-sloping line, visually communicating that the relationship is proportional: if the distance doubles, the recession velocity doubles as well. The slope of this line is the Hubble constant (H₀), which expresses the rate of expansion of the universe today. Even without formulas in the diagram, arrows radiating outward from Earth or from a general observation point show galaxies moving away with lengths of arrows increasing with distance.
A more global illustration of expansion often replaces galaxies with dots on the surface of an inflating balloon. As the balloon grows, all dots grow farther apart, yet none of them occupy a privileged center. This helps explain that galaxies are not flying through space from a central explosion; rather, space itself is expanding, carrying galaxies along the way. When multiple balloon snapshots are displayed side-by-side, the viewer readily sees that nearby dots separate slowly, while widely spaced dots separate much more quickly, visually reproducing the proportional recession of Hubble’s and Lemaître’s laws. This analogy also eliminates the misconception that the Milky Way is the “center” of the universe. In reality, any observer anywhere would see all distant galaxies moving away—evidence not of a central origin point in space but of the universal expansion of space itself.
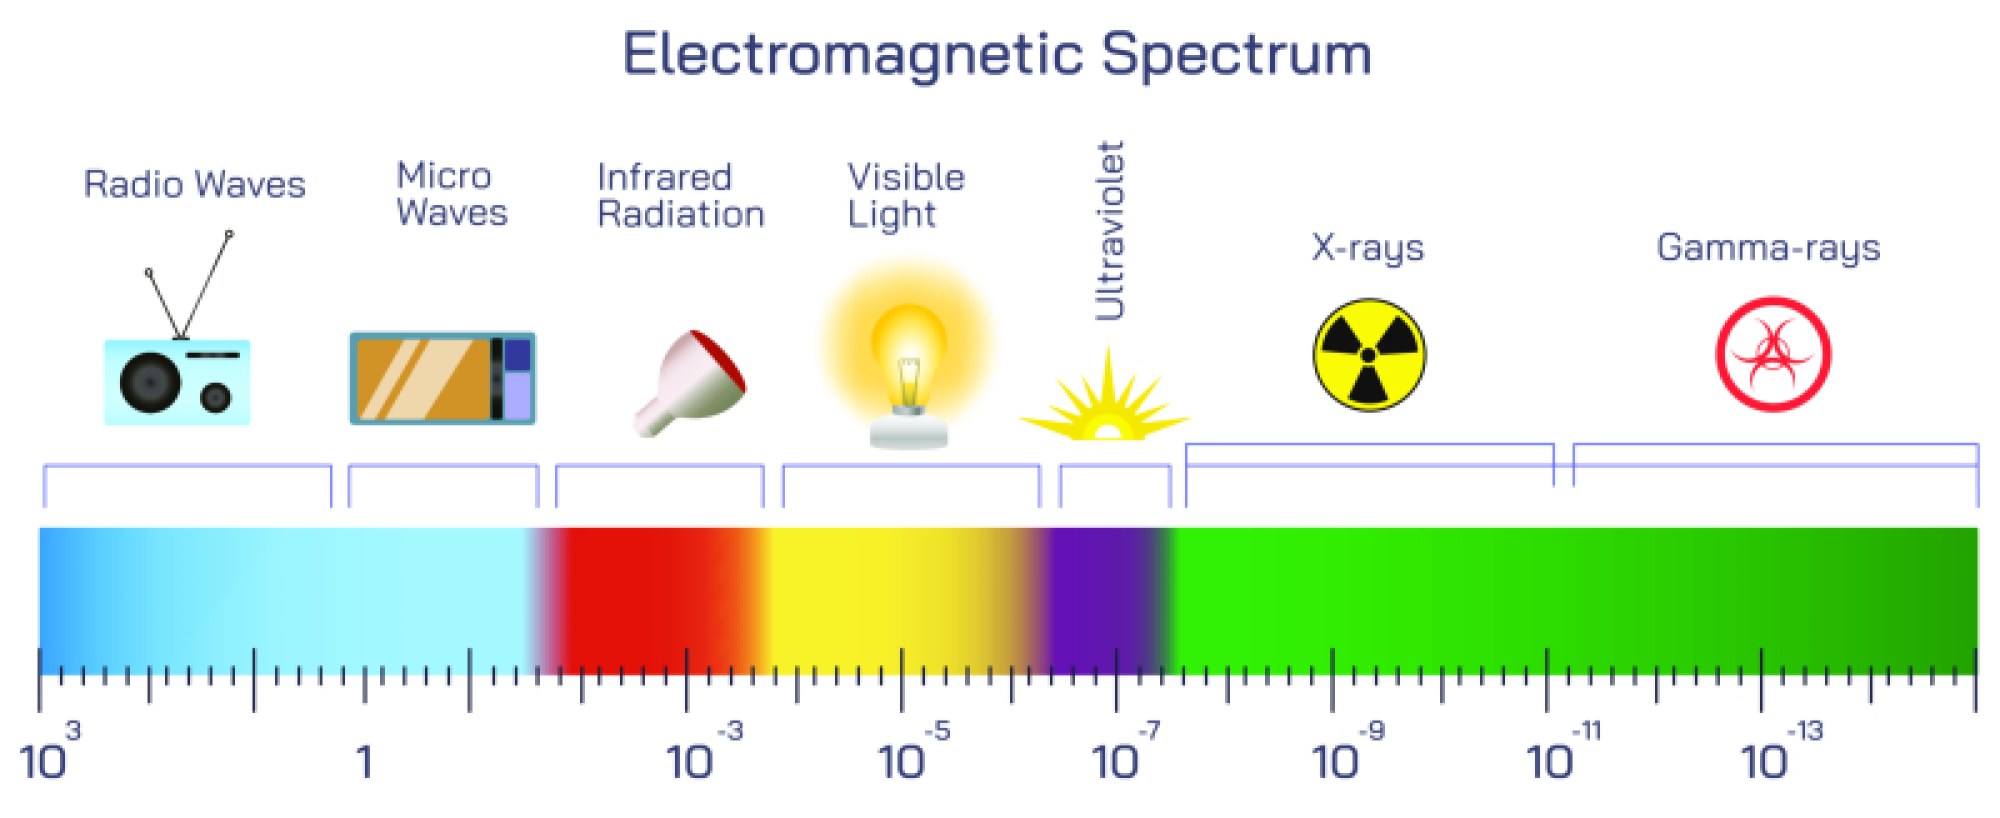
A central element of Hubble and Lemaître illustrations is redshift, the phenomenon that reveals cosmic motion. When light from a galaxy stretches due to the expansion of space, its wavelength lengthens toward the red end of the electromagnetic spectrum. Diagrams typically show the absorption or emission lines of hydrogen—very thin dark or bright lines recorded in a spectrum—shifted slightly toward longer wavelengths. If the galaxy is far away and receding quickly, the spectral lines shift much farther, creating a detectable pattern. These diagrams make clear that redshift is not simply a Doppler effect from objects moving through space but a direct result of the stretching of space itself. The greater the redshift, the farther the light has traveled and the faster the galaxy is receding, allowing astronomers to infer the scale and rate of expansion.
Some illustrations combine cosmic distance ladders with Hubble’s relation to emphasize how astronomers determine galaxy distances in the first place. Cepheid variable stars—whose intrinsic brightness cycles with predictable regularity—often appear as markers that calibrate distance for nearer galaxies. Supernovae, particularly Type Ia supernovae, appear as distance indicators for farther regions. When these celestial objects are placed onto the Hubble–Lemaître plot, they extend the relationship deeper into the universe, confirming that the proportional trend holds over immense scales. These diagrams underscore that the expansion isn’t a local phenomenon but a universal one acting across billions of light-years.
More advanced illustrations show that Hubble’s and Lemaître’s laws apply to a universe whose scale factor changes over time. In early cosmology, the expansion was often assumed to slow gradually. However, observations of distant supernovae later revealed that expansion is accelerating, driven by an unknown force that cosmologists call dark energy. While this discovery goes beyond Hubble and Lemaître’s original formulations, some modern illustrations overlay curves showing how the slope of the expansion rate has changed over cosmic time. Such images compare galaxies spread across the observable universe in snapshots from billions of years ago to the present, revealing that galaxies are not only receding but doing so at an accelerating pace.
Another form of illustration shows the Hubble sphere—the distance at which the recession velocity of galaxies reaches the speed of light relative to the observer. Beyond this boundary, galaxies still exist and continue to move away, but their recession speed exceeds the speed of light because space itself is expanding rather than matter traveling through space. These diagrams, which often include a dotted boundary around an observation point, clarify that cosmic expansion does not violate the physics of relativity, because no galaxy is locally outrunning light within its own space; instead, the metric of space stretches between points.
Visual timelines used to explain Hubble’s and Lemaître’s laws often begin with the early universe—dense, hot, and compact—and expand outward to show galaxies spreading apart. Such illustrations capture Lemaître’s original insight: if the universe is expanding now, it must once have been compressed—a conclusion that later evolved into the Big Bang framework. Extending the timeline forward, these diagrams portray increasing separation between galaxies, highlighting that the universe will become colder, darker, and more diffuse as expansion continues indefinitely.
Ultimately, an illustration that combines Hubble’s and Lemaître’s laws does more than show distant galaxies drifting apart—it provides a visual explanation for one of the greatest realizations in science. It connects measurable redshift to the large-scale evolution of the cosmos, ties the movement of galaxies to the expansion of space, and builds an intuitive path from observations through telescopes to the sweeping conclusion that the universe has a history, a dynamic structure, and a changing future. It reflects how empirical data, theoretical reasoning, and visual representation converged to transform the way humanity understands its place in the universe—not within a static and eternal cosmos, but inside a continually expanding and evolving one.