Osteoporosis Stages Illustrated: Bone Density Loss from Healthy to Severe Condition
Osteoporosis is a progressive skeletal disorder characterized by reduced bone mass, structural deterioration, and increased fracture risk. Understanding its stages is crucial for medical education, patient awareness, and preventive healthcare, as early detection and intervention can significantly reduce complications. A vector illustration of osteoporosis typically integrates bone density visualization, structural comparison across stages, and clinical implications, providing a clear, educational, and visually intuitive depiction of bone health progression. By combining labeled bone cross-sections, color-coded density scales, and fracture risk indicators, such illustrations allow learners to understand the gradual nature of bone loss and its functional consequences.
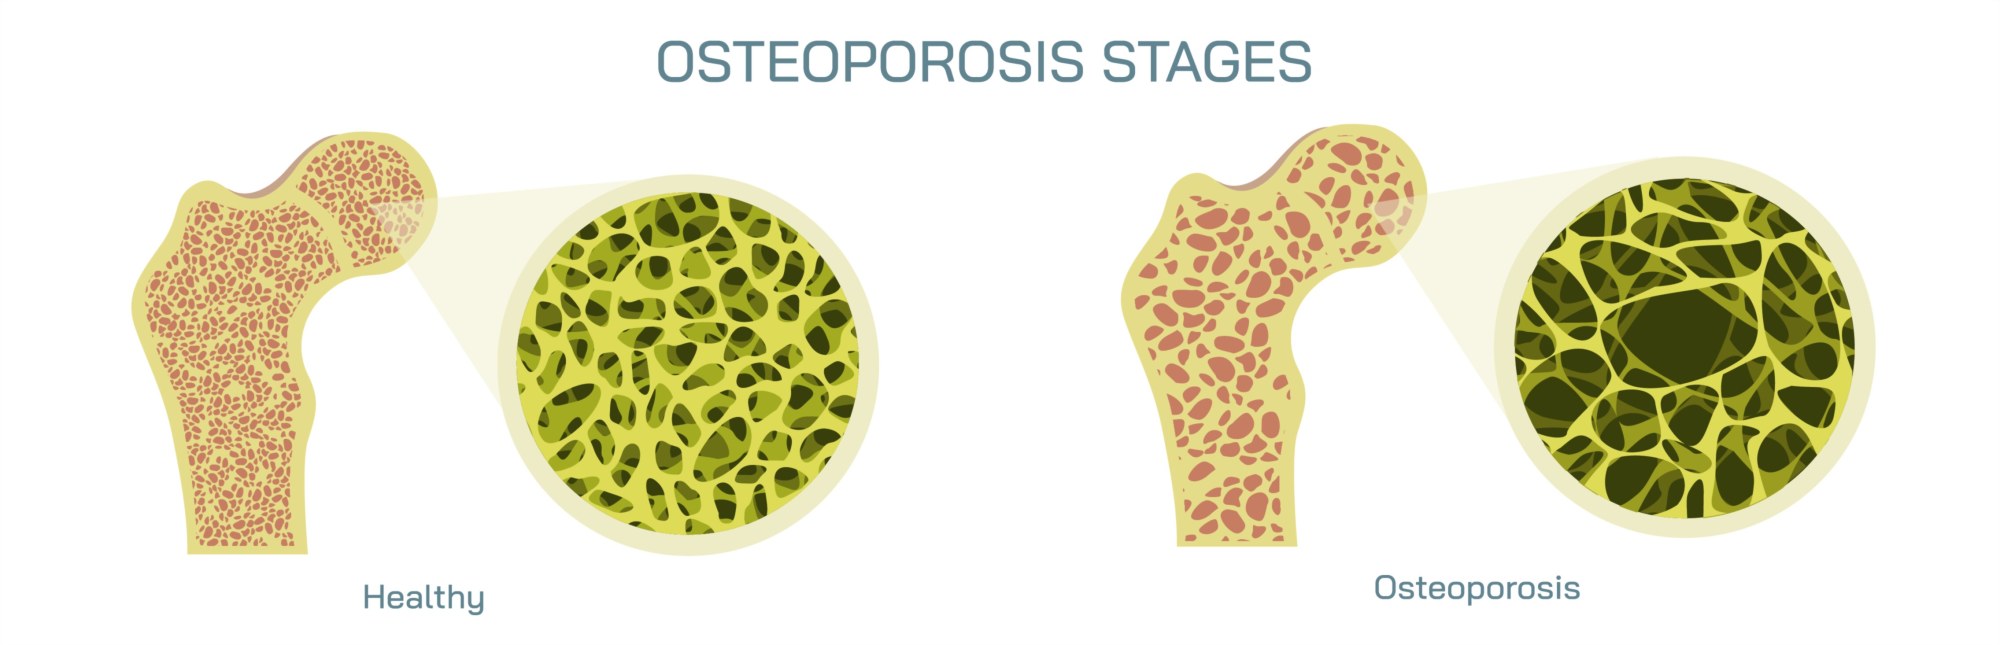
At the center of the illustration is a series of bone cross-sections, arranged sequentially from healthy bone to severe osteoporosis. Each bone section is color-coded to represent bone mineral density (BMD), with bright shades indicating high density in healthy bone and progressively lighter shades illustrating density loss in mild, moderate, and severe osteoporosis. Labels indicate each stage: Normal, Osteopenia, Osteoporosis (Moderate), and Severe Osteoporosis, providing a structured progression that learners can visually track. Arrows between stages highlight the gradual decline in bone density over time.
Healthy bone is depicted with a dense trabecular network, showing thick, interconnected spongy bone and a sturdy cortical layer. Labels indicate cortical bone, trabecular bone, and bone marrow spaces, emphasizing the strong structural integrity and resistance to fracture. Magnified insets may highlight the tightly packed trabeculae, visually conveying strength and mechanical stability.
Mild bone loss (Osteopenia) is illustrated with slightly thinner trabeculae and minor widening of the bone marrow spaces. Labels indicate a slight reduction in bone mass and structural weakening, providing early-stage visual cues for reduced skeletal robustness. Arrows may show decreased support capacity, linking structural changes to an increased but still moderate risk of fractures. Color gradients reinforce the relative decrease in density compared to healthy bone.
Moderate osteoporosis is shown with more pronounced thinning of trabecular bone, larger marrow spaces, and partial cortical thinning. Labels emphasize reduced mechanical strength, compromised microarchitecture, and heightened fracture susceptibility, particularly in vertebrae, hips, and wrists. Magnified insets may show fractures developing under minimal stress, visually illustrating the clinical relevance of structural degradation. Arrows highlight the progressive loss of connectivity between trabeculae, linking microscopic changes to macroscopic consequences.
Severe osteoporosis depicts extensive bone mass loss with very thin, fragile trabeculae and significantly weakened cortical bone. Labels indicate high fracture risk, structural collapse, and severe functional impairment. Color-coded overlays may highlight critical points prone to fracture, such as the vertebral bodies, femoral neck, or distal radius. Magnified sections illustrate microfractures and porous bone architecture, emphasizing the critical condition and the importance of medical intervention.
Vector diagrams may also include comparative metrics, such as bone mineral density (BMD) values in g/cm² or T-scores. Arrows and labels indicate thresholds for normal, osteopenia, and osteoporosis, connecting visual representation to clinical diagnostic criteria. Optional insets may show fracture examples, linking structural deterioration to real-world consequences like vertebral compression fractures or hip fractures.
Additional educational features include age progression panels showing how bone density declines over time due to factors like hormonal changes, calcium deficiency, vitamin D insufficiency, or sedentary lifestyle. Arrows indicate acceleration in postmenopausal women or elderly populations, highlighting risk factors and preventive measures. Labels may indicate interventions such as calcium and vitamin D supplementation, weight-bearing exercise, or pharmacologic treatments, connecting structural illustration to management strategies.
By combining bone cross-sections, density gradients, labeled trabeculae and cortical layers, fracture risk markers, and clinical annotations, a vector illustration of osteoporosis stages provides a comprehensive understanding of bone health deterioration. Color coding, directional arrows, magnified insets, and sequential arrangement make structural and functional changes visually intuitive, linking microscopic changes to macroscopic consequences.
Ultimately, an osteoporosis stages vector illustration demonstrates the progressive nature of bone density loss from healthy bone to severe osteoporosis, highlighting the importance of early detection, lifestyle interventions, and clinical management. Through labeled structures, density visualization, fracture indicators, and age-related progression panels, the diagram transforms abstract skeletal pathology into an educational, visually engaging, and intuitive tool for medical students, healthcare professionals, and patient education.