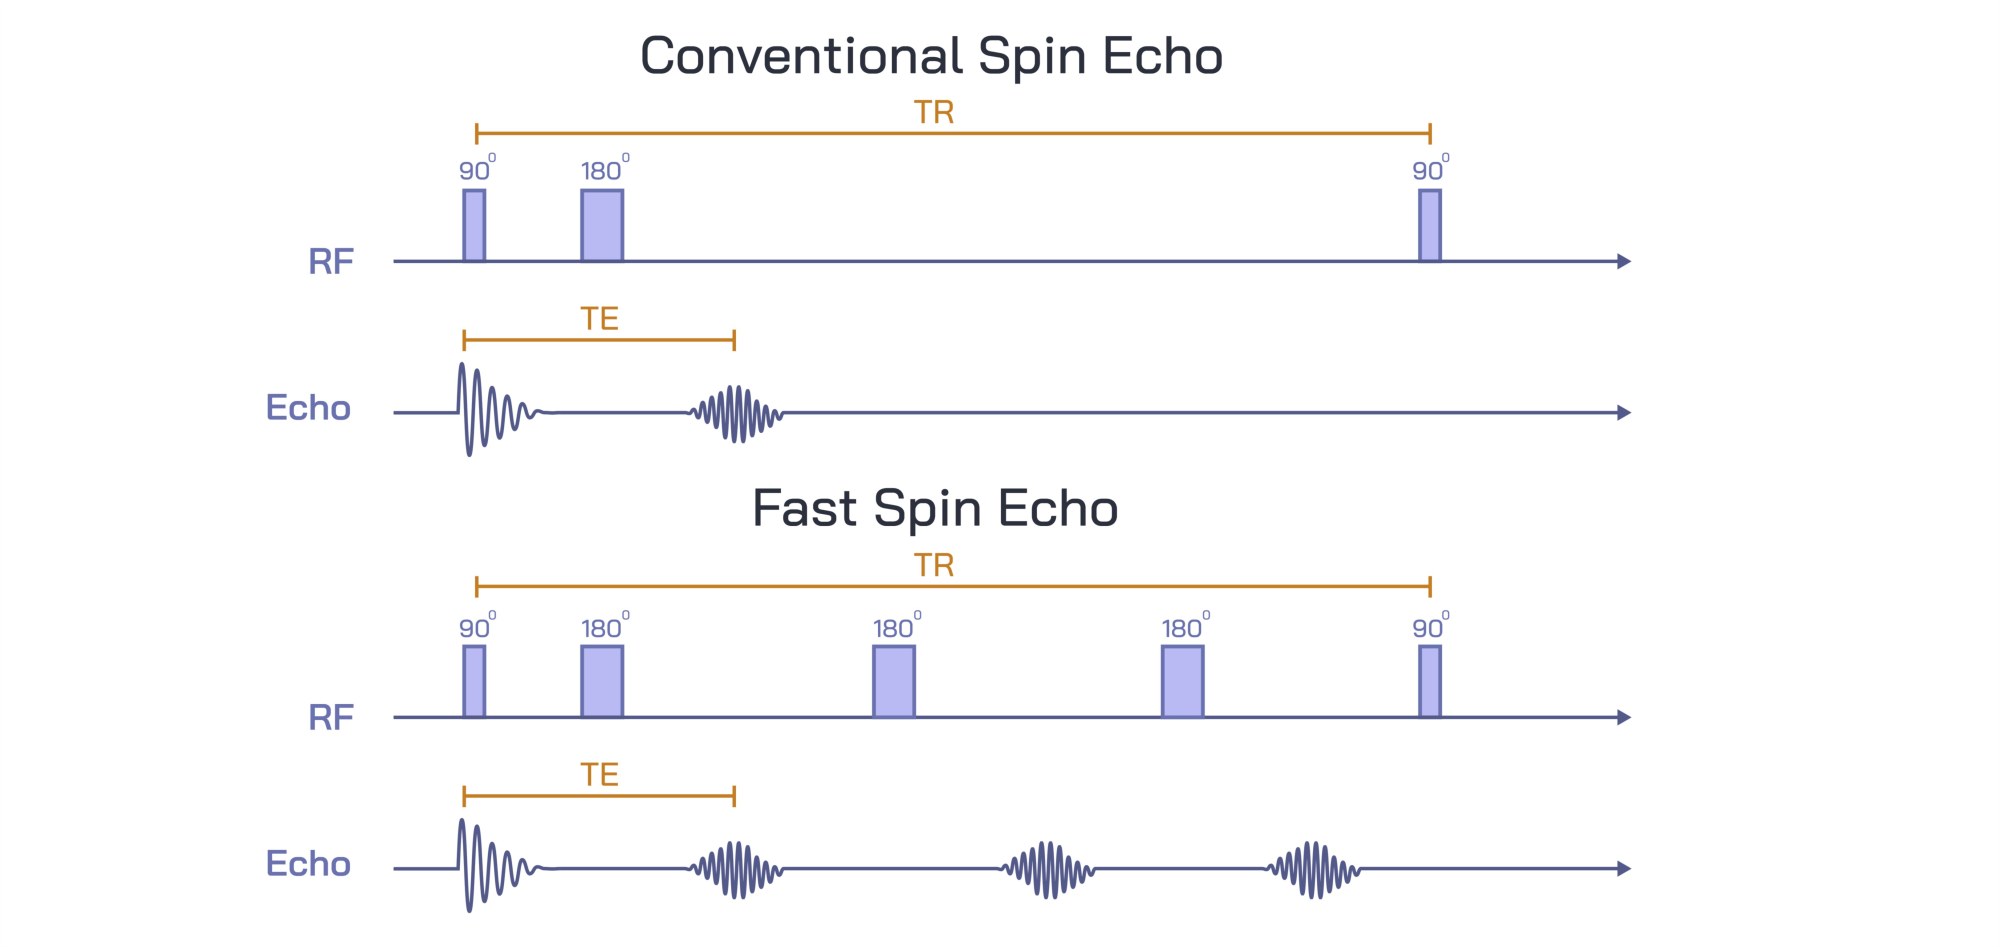
Conventional Spin Echo vs Fast Spin Echo MRI Sequence Comparison Showing Image Quality and Scan Efficiency Differences
Magnetic Resonance Imaging (MRI) is a non-invasive diagnostic technique that generates high-resolution images of internal structures using magnetic fields and radiofrequency pulses. Among MRI pulse sequences, the Conventional Spin Echo (CSE) and Fast Spin Echo (FSE) sequences are widely used, each with distinct advantages and limitations in terms of image quality, acquisition speed, and clinical application. A vector illustration comparing CSE and FSE sequences typically integrates pulse sequence diagrams, timing parameters, signal acquisition, and resultant image characteristics, providing a clear and educational representation of their differences. By combining labeled sequences, timing charts, and comparative image panels, such illustrations allow learners and practitioners to visualize both the operational principles and practical implications of each sequence.
At the center of the illustration is a dual-panel comparison, showing the CSE sequence on one side and the FSE sequence on the other. Each panel includes a pulse sequence diagram, depicting 90° and 180° radiofrequency (RF) pulses, spin refocusing events, and echo signals (TE). In the CSE panel, a single 90° excitation pulse is followed by a single 180° refocusing pulse to generate a spin echo, with labels highlighting the echo time (TE) and repetition time (TR). Arrows indicate the direction of spin refocusing and signal acquisition, visually clarifying the mechanism for image formation. Color coding distinguishes excitation and refocusing pulses from acquired echoes, enhancing clarity.
The FSE sequence panel illustrates a 90° excitation pulse followed by multiple 180° refocusing pulses, generating a train of echoes. Arrows indicate the acquisition of multiple lines of k-space per TR, demonstrating how FSE reduces scan time compared to conventional spin echo. Labels identify key parameters such as effective echo time (TEeff), echo train length (ETL), and repetition time (TR), highlighting differences in timing and data acquisition efficiency. Color gradients or overlays may differentiate individual echoes within the echo train, emphasizing the cumulative effect of multiple refocusing events.
Adjacent to the pulse diagrams are representative image panels, showing typical MRI outputs for each sequence. The CSE images are labeled to emphasize high signal-to-noise ratio (SNR), excellent tissue contrast, and minimal blurring, illustrating the sequence’s strength in producing high-quality, diagnostically reliable images, albeit with longer scan times. Arrows or callouts may highlight fine anatomical details visible in CSE images, such as cortical structures, ligament fibers, or soft tissue boundaries.
FSE images are labeled to highlight reduced scan time, maintained tissue contrast, and slightly increased image blurring due to the echo train, showing the trade-off between speed and image sharpness. Arrows may indicate subtle differences in spatial resolution or artifact patterns, emphasizing practical considerations in clinical imaging. Comparative callouts may quantify scan efficiency gains, such as 3–5× faster acquisition, helping learners understand the operational benefits of FSE in routine and time-sensitive imaging.
Additional vector elements include timeline overlays, comparing the total acquisition time for both sequences. Arrows and labels indicate how multiple echoes per TR in FSE reduce total scan time while preserving diagnostic information. Insets may illustrate k-space coverage, showing that CSE acquires one line per TR, whereas FSE acquires multiple lines per TR, visually reinforcing the mechanism of efficiency improvement.
Magnified insets may also show clinical relevance examples, such as imaging of the brain, spine, or joints. Arrows indicate how FSE is favored in situations requiring rapid acquisition, such as patient movement, pediatric imaging, or high-throughput clinical workflows. CSE remains relevant for research applications or situations requiring maximal image clarity, with arrows highlighting anatomical structures that benefit from higher SNR and reduced artifacts.
By combining pulse sequence diagrams, echo acquisition pathways, representative images, timing charts, and comparative annotations, a vector illustration of CSE versus FSE MRI sequences provides a comprehensive understanding of their operational and clinical differences. Color coding, directional arrows, and labeled panels allow learners to visualize the sequence mechanics, image quality outcomes, and efficiency trade-offs in a clear, intuitive format.
Ultimately, a CSE versus FSE vector illustration demonstrates the balance between image quality and scan efficiency, showing how sequence selection impacts diagnostic clarity, patient throughput, and clinical workflow. Through labeled pulse diagrams, echo trains, representative images, and timing overlays, the diagram transforms abstract MRI physics into an educational, visually engaging, and practical tool for medical imaging, radiology education, and MRI protocol optimization.