In-Plane vs Through-Plane Thermal Conductivity Vector Illustration Showing Heat Flow Directions in Materials and Layer Orientation Differences
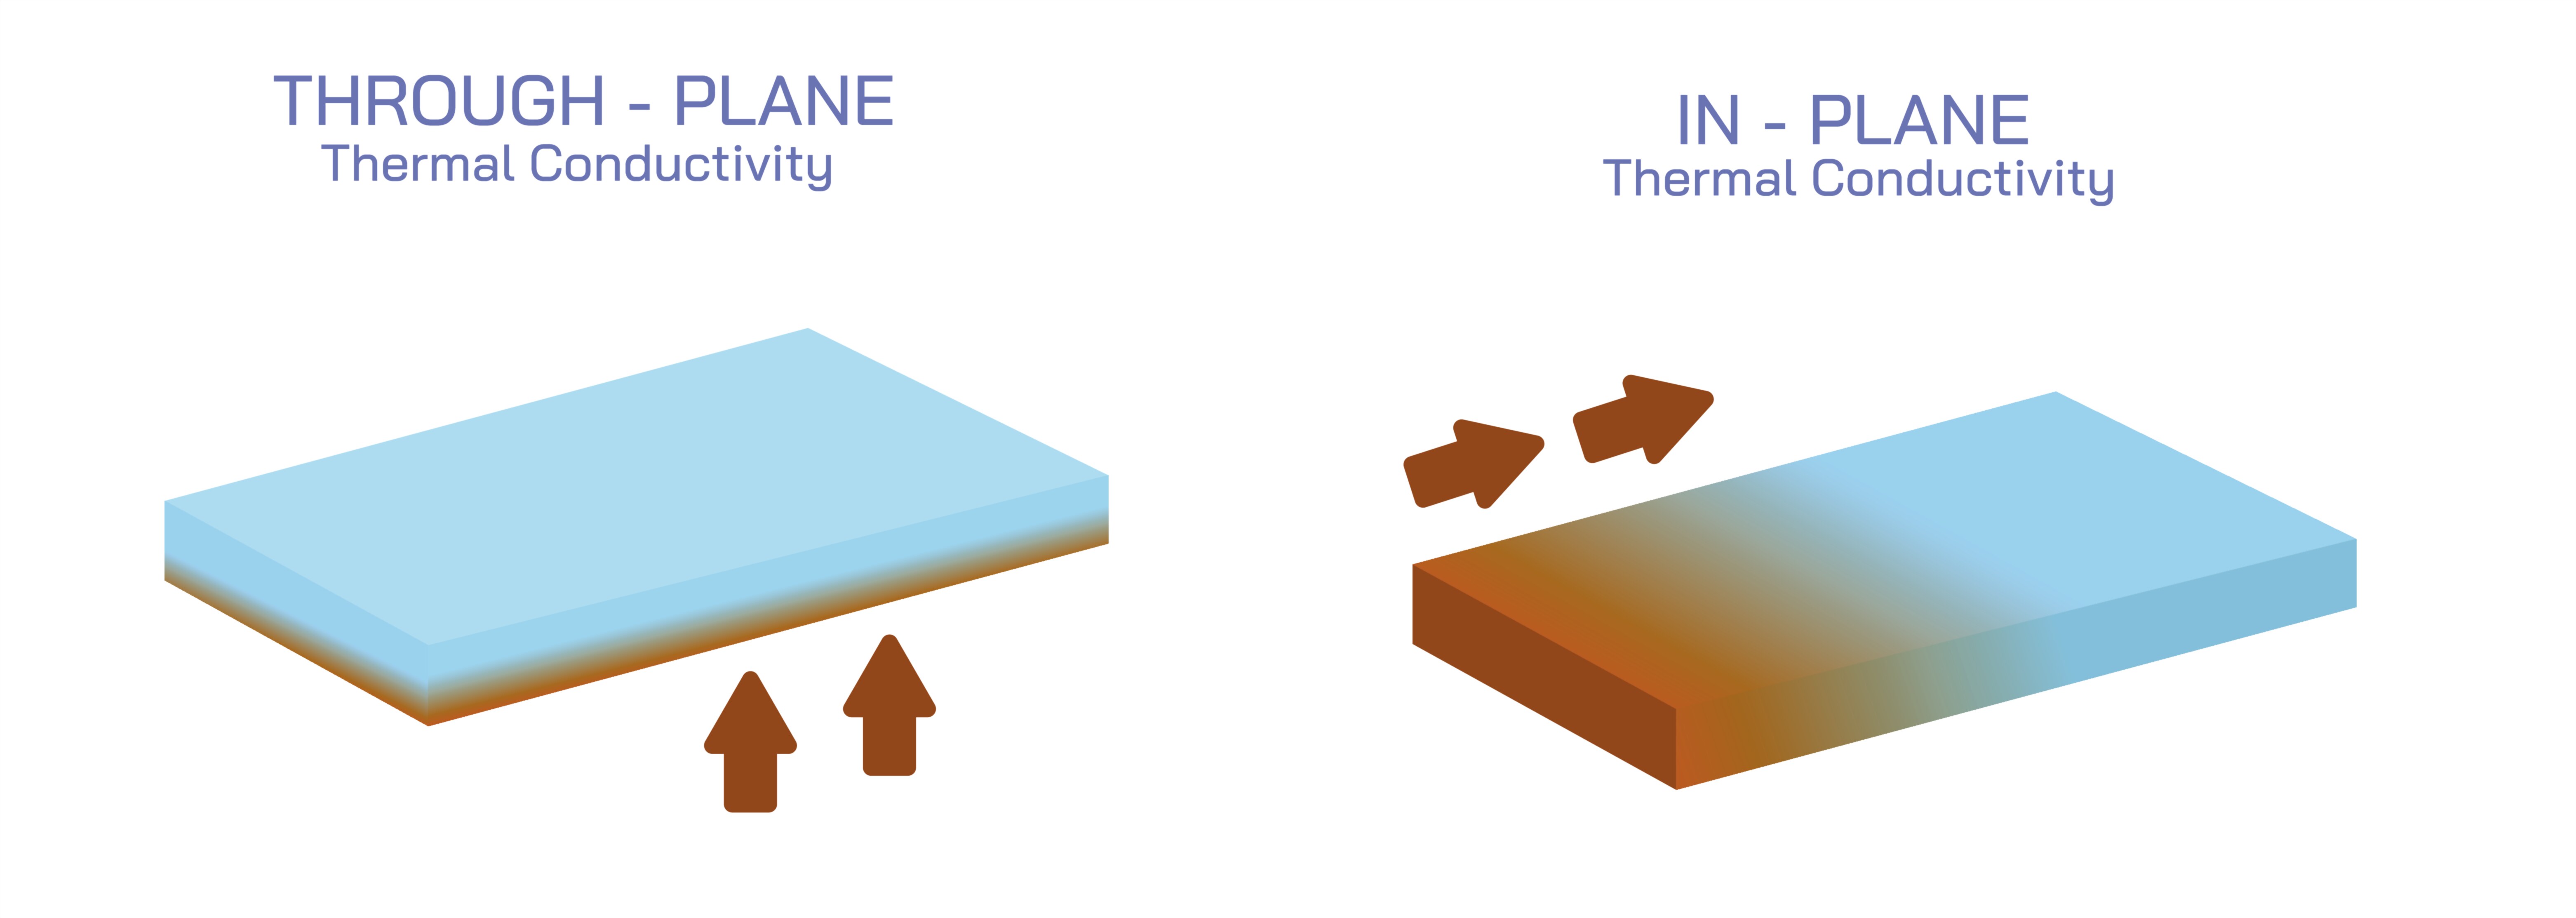
Thermal conductivity is a critical property of materials, describing their ability to conduct heat. In anisotropic materials—such as composites, layered films, or engineered solids—thermal conductivity can differ depending on the direction of heat flow relative to material layers. Two common terms describing this behavior are in-plane thermal conductivity (heat flow parallel to layers) and through-plane thermal conductivity (heat flow perpendicular to layers). A vector illustration depicting in-plane vs through-plane thermal conductivity typically integrates layered material structure, directional heat flow, and comparative conductivity arrows, providing a visually intuitive understanding of anisotropic heat transfer in materials. By combining labeled layers, color-coded heat flow arrows, and dimensional orientation indicators, such diagrams allow learners to clearly differentiate the two types of thermal conductivity and understand their practical implications.
At the center of the illustration is a schematic of a layered material, shown as a stack of thin sheets or lamellae. The layers are often depicted in alternating colors or shading to clearly distinguish individual layers and highlight structural orientation. Labels indicate the material’s layer thickness, composition, and orientation, emphasizing the anisotropic nature that affects thermal conduction. Arrows are used to show heat flow directions, with red or orange arrows representing energy transfer, providing a clear visual cue for thermal pathways.
In-plane thermal conductivity is illustrated with arrows running parallel to the layers, indicating that heat travels along the plane of the sheets. Labels indicate “in-plane (parallel to layers)” and may include directional markers (x-axis or horizontal orientation) to reinforce spatial understanding. The arrows are often longer or more numerous compared to through-plane representations, visually conveying higher heat transfer efficiency along the layers. Color gradients along the arrows may further illustrate temperature gradients or heat flux intensity, connecting structural orientation to thermal performance.
Through-plane thermal conductivity is depicted with arrows running perpendicular to the layers, showing heat transfer across the stacked sheets. Labels indicate “through-plane (perpendicular to layers)” and may include vertical axis markers (z-axis), clarifying directional orientation relative to the material plane. Arrows are often shorter or fewer in number to visually convey that thermal conduction is less efficient through the layers, reflecting anisotropy commonly observed in laminates, thin films, and composite materials. Gradients along these arrows may depict reduced heat flux or thermal resistance in the through-plane direction, emphasizing practical implications for material design.
The illustration often includes side-by-side comparison panels, showing the same material with heat flow arrows in both orientations simultaneously. This enables learners to immediately recognize differences in thermal conductivity due to layer orientation, providing a quantitative and qualitative understanding of anisotropic heat transfer. Labels may indicate relative magnitudes, such as “k_in-plane >> k_through-plane,” where k represents thermal conductivity.
Magnified insets may show molecular or microstructural explanations for anisotropic conductivity. For example, vector diagrams may illustrate atomic bonding or polymer chain alignment along the layer plane, explaining why heat moves more efficiently along the plane rather than perpendicular to it. Arrows representing phonon or electron transport pathways can reinforce the physical mechanisms behind observed differences, linking microstructure to macroscopic thermal properties.
Additional features may include temperature gradient representation, using color shading across layers. In-plane conduction panels may show even temperature distribution along layers, while through-plane panels may depict steeper temperature gradients across the layer stack, visually communicating thermal resistance differences. This enhances conceptual understanding of how heat propagates differently depending on orientation.
Vector illustrations may also incorporate engineering or application context. Examples include printed circuit boards (PCBs), layered composite materials, thermally conductive films, and heat spreaders, showing where in-plane and through-plane conductivity are critical in real-world design. Arrows or annotations may highlight preferred heat flow paths for cooling components or optimizing thermal management.
By combining layered material schematics, directional heat flow arrows, comparative in-plane and through-plane panels, magnified microstructure insets, and temperature gradient shading, a vector illustration of in-plane vs through-plane thermal conductivity provides a comprehensive understanding of anisotropic heat transfer. Color coding, labeled arrows, and spatial orientation markers make the differences immediately intuitive, bridging structural configuration with thermal performance.
Ultimately, a vector illustration of in-plane and through-plane thermal conductivity demonstrates the relationship between material layer orientation and directional heat transfer, helping learners visualize and quantify anisotropy in thermal properties. Through labeled layers, directional arrows, temperature gradients, and comparative panels, the diagram transforms abstract heat conduction concepts into an educational, visually engaging, and practical tool for materials science, physics, and engineering education.