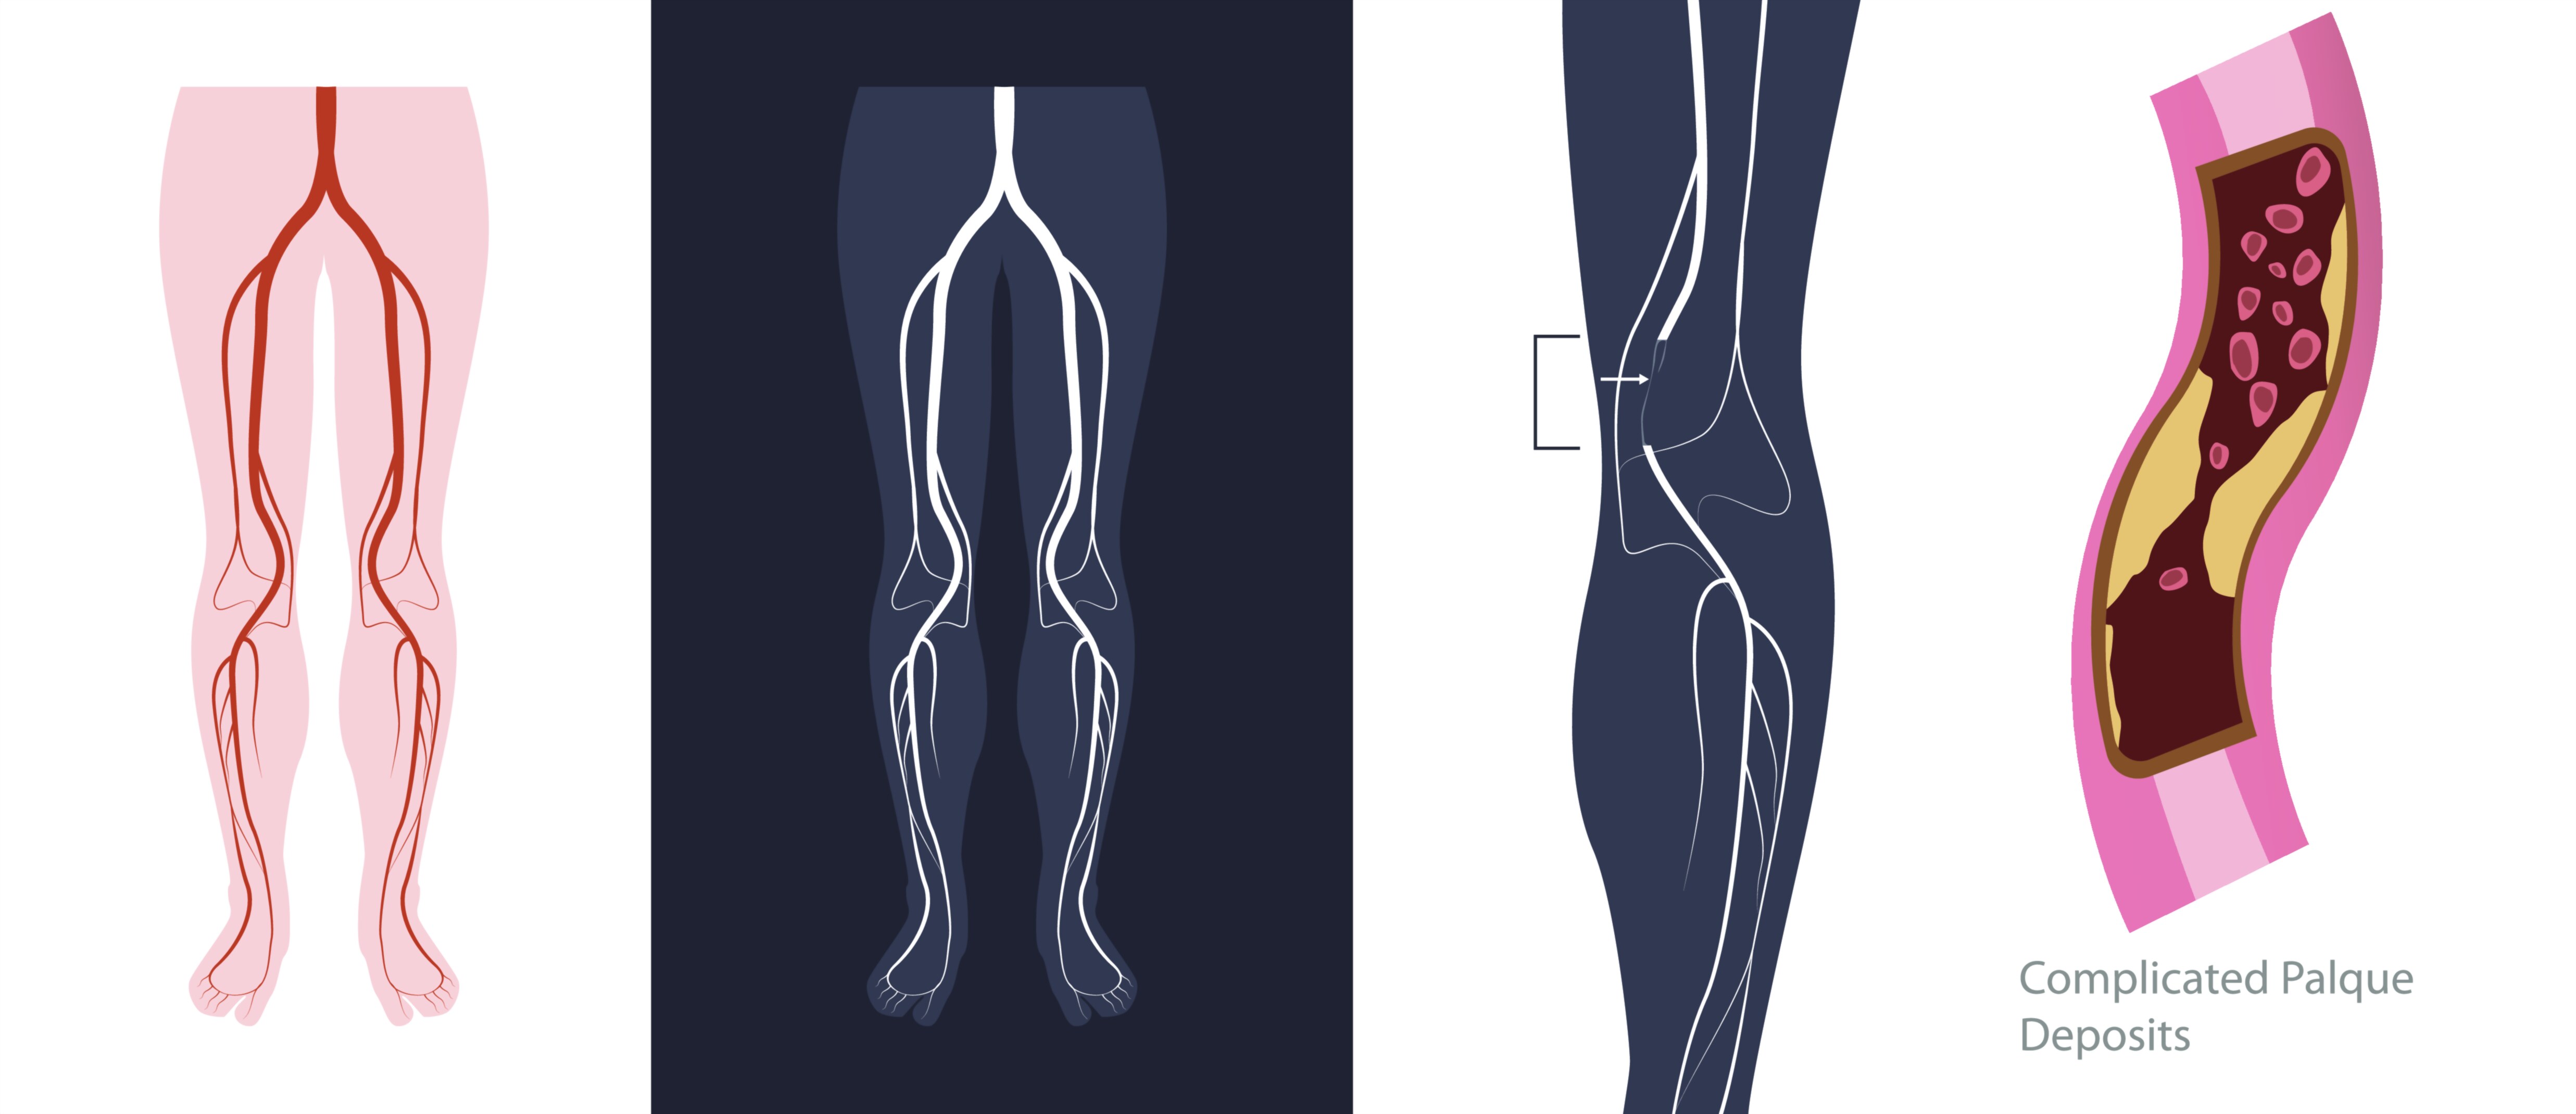
Leg Artery Clogged with Fat and Calcium Vector Illustration Showing Blood Flow Blockage and Atherosclerosis Process
Atherosclerosis is a progressive cardiovascular condition in which arteries become narrowed and hardened due to the accumulation of fatty deposits, cholesterol, and calcium, impeding normal blood flow. When this occurs in the leg arteries, it is known as peripheral artery disease (PAD), which can lead to pain, reduced mobility, tissue ischemia, and even gangrene in severe cases. A vector illustration of a clogged leg artery typically combines anatomical representation of the leg vasculature, cross-sectional views of arteries, and the progression of plaque formation, allowing learners and medical professionals to visualize the mechanism of arterial blockage and its clinical consequences. By integrating structural, pathological, and functional perspectives, such illustrations provide a clear and educational explanation of atherosclerosis in the peripheral circulation.
At the center of the illustration is a longitudinal view of a leg artery, showing the major arteries supplying blood to the leg, including the femoral, popliteal, and tibial arteries. These vessels are depicted in bright red or another color-coded hue to indicate oxygenated blood flow under normal conditions. Arrows along the artery indicate the direction of blood flow. In the affected artery, plaques composed of lipid deposits, cholesterol, and calcified regions are illustrated as irregular, textured obstructions protruding into the arterial lumen. Color coding is used to distinguish between healthy artery walls, soft fatty deposits, and hardened calcium deposits, visually emphasizing the severity of blockage.
A key component of the vector illustration is the cross-sectional view of the clogged artery, showing the relative proportion of lumen space versus plaque. The arterial wall is labeled, highlighting the intima, media, and adventitia layers, with the plaque embedded primarily in the intima. Fatty deposits are often depicted as yellow or orange regions, while calcified areas are shown in white or gray, illustrating the stiffening of the arterial wall. Arrows indicate the restricted flow of blood through the narrowed lumen, demonstrating how the obstruction reduces oxygen and nutrient delivery to downstream tissues. Magnified sections may highlight plaque composition and the gradual encroachment into the arterial lumen.
Vector diagrams frequently illustrate the progression of atherosclerosis in stages. Early-stage deposition shows a small fatty streak within the artery wall, which gradually accumulates more lipids, inflammatory cells, and calcium over time. Intermediate stages demonstrate partial obstruction with some reduction in blood flow, while advanced stages depict near-total occlusion, with arrows indicating severely limited circulation. Labels indicate each stage, emphasizing the progressive nature of the disease and the importance of early detection and intervention.
Another feature in the illustration is the impact on blood flow dynamics. Velocity arrows in normal sections of the artery may be shown as smooth and uniform, while in clogged regions, arrows are compressed, turbulent, or irregular, visually representing the hemodynamic consequences of narrowing. Flow reduction may also be indicated downstream, illustrating how tissues supplied by the artery experience hypoxia or ischemia due to inadequate perfusion. This component connects structural obstruction with functional impairment, reinforcing the physiological significance of atherosclerosis.
Additional elements may include associated tissues of the leg, such as muscles, veins, and surrounding connective tissue, providing anatomical context. Cross-sectional insets may show how ischemia affects muscle fibers or nerve endings, explaining symptoms such as leg pain, cramping, and reduced mobility often associated with PAD. Some illustrations also highlight collateral vessels that may develop to bypass blockages, visually demonstrating the body’s adaptive response to chronic arterial obstruction.
Vector illustrations often emphasize clinical relevance, including risk factors and consequences. Labels may indicate fatty plaque formation due to high cholesterol, calcium deposition from mineral imbalance, and inflammatory responses contributing to arterial stiffening. Arrows or callouts may highlight potential complications, such as thrombosis, embolism, tissue necrosis, or gangrene, demonstrating why early diagnosis and treatment are critical.
By combining longitudinal and cross-sectional views, plaque composition, arterial layers, blood flow direction, and affected tissues, a vector illustration of a clogged leg artery provides a detailed and comprehensive visualization of peripheral atherosclerosis. It conveys the progression from initial lipid accumulation to severe obstruction, linking structural changes with functional and clinical outcomes. Color coding, arrows, magnified insets, and labels enhance clarity, making complex pathological processes accessible for education, patient awareness, and clinical training.
Ultimately, a vector illustration of a leg artery clogged with fat and calcium demonstrates the mechanism and consequences of atherosclerosis, showing how deposits narrow the lumen, impede blood flow, and compromise tissue health. Through labeled artery layers, plaque depiction, blood flow visualization, and downstream tissue impact, the diagram transforms an abstract cardiovascular pathology into a clear, intuitive, and educational visual tool for understanding the critical importance of vascular health in the human body.