Temperature and Specific Heat Illustration Explaining Heat Capacity and Thermal Energy Concepts
Temperature and specific heat are two of the most important concepts in thermal physics, and yet they describe completely different ideas that often become clearer when visualized together. A temperature and specific heat illustration typically begins by showing two or more substances exposed to the same supply of heat and then comparing how their temperatures respond. Even without equations, a mental picture of this comparison highlights the distinction: temperature measures how warm or cold something is, while specific heat explains how much thermal energy a material must absorb before its temperature changes noticeably. Thermal energy represents the total internal energy associated with the motion of particles in a substance, and specific heat represents the resistance of a material to rising in temperature when it absorbs that energy. The difference between these concepts is subtle in language but striking when illustrated visually with objects heating at different rates under identical conditions.
A simple illustration shows two containers placed side by side and heated by equal amounts of energy—perhaps one filled with water and the other with sand or metal pellets. As the heat source applies energy uniformly to both, the temperature in the sand or metal rises quickly while the temperature of the water increases far more slowly. The comparison shows that water possesses a high specific heat because it absorbs a large amount of thermal energy without undergoing a dramatic rise in temperature. Metals exhibit low specific heat because even a small amount of thermal energy makes their temperature increase noticeably and rapidly. In a visual depiction, the temperature of the water might be represented by a slowly rising thermometer, while the metal or sand thermometer shoots upward after absorbing the same energy. The illustration becomes not merely a picture of temperature, but a comparison of heat capacity across materials—demonstrating how the same energy input does not produce the same temperature change in different substances.
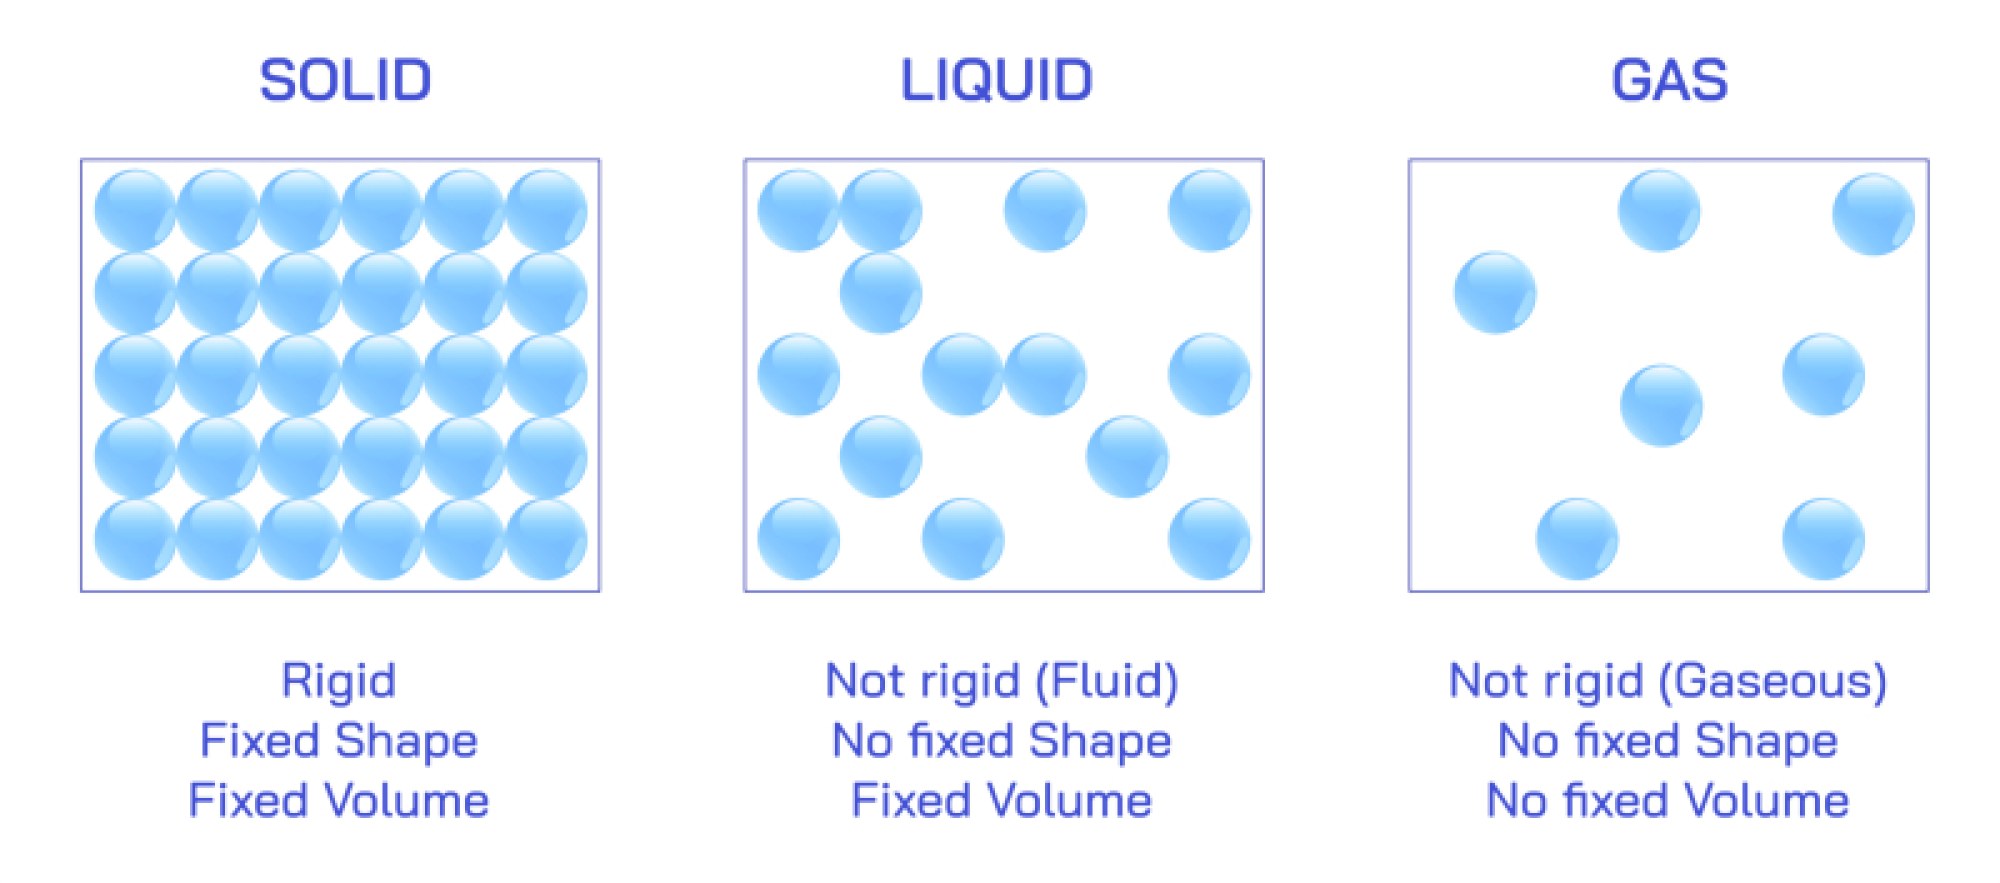
Temperature is usually visualized in such diagrams not as a physical object but as a state determined by particle motion. In a pictorial interpretation, particles in a hot material move quickly and chaotically, with large, expressive motion arrows showing their kinetic energy. Particles in a cooler material move more slowly, with shorter, more relaxed motion arrows. Even though particles are invisible to the human eye, this depiction helps explain that temperature increases when particles begin to move faster and decreases when their motion slows. Temperature represents average particle kinetic energy—higher temperature means more vigorous motion on a microscopic scale. To illustrate this connection, a diagram may contrast a hot object and a cold object side by side, showing densely vibrating or rapidly moving particles in the hotter substance, while the colder substance contains particles moving more gently in organized but slower patterns. The visual contrast captures the idea that temperature does not depend solely on how much energy a material contains overall, but on how much kinetic energy each particle, on average, experiences.
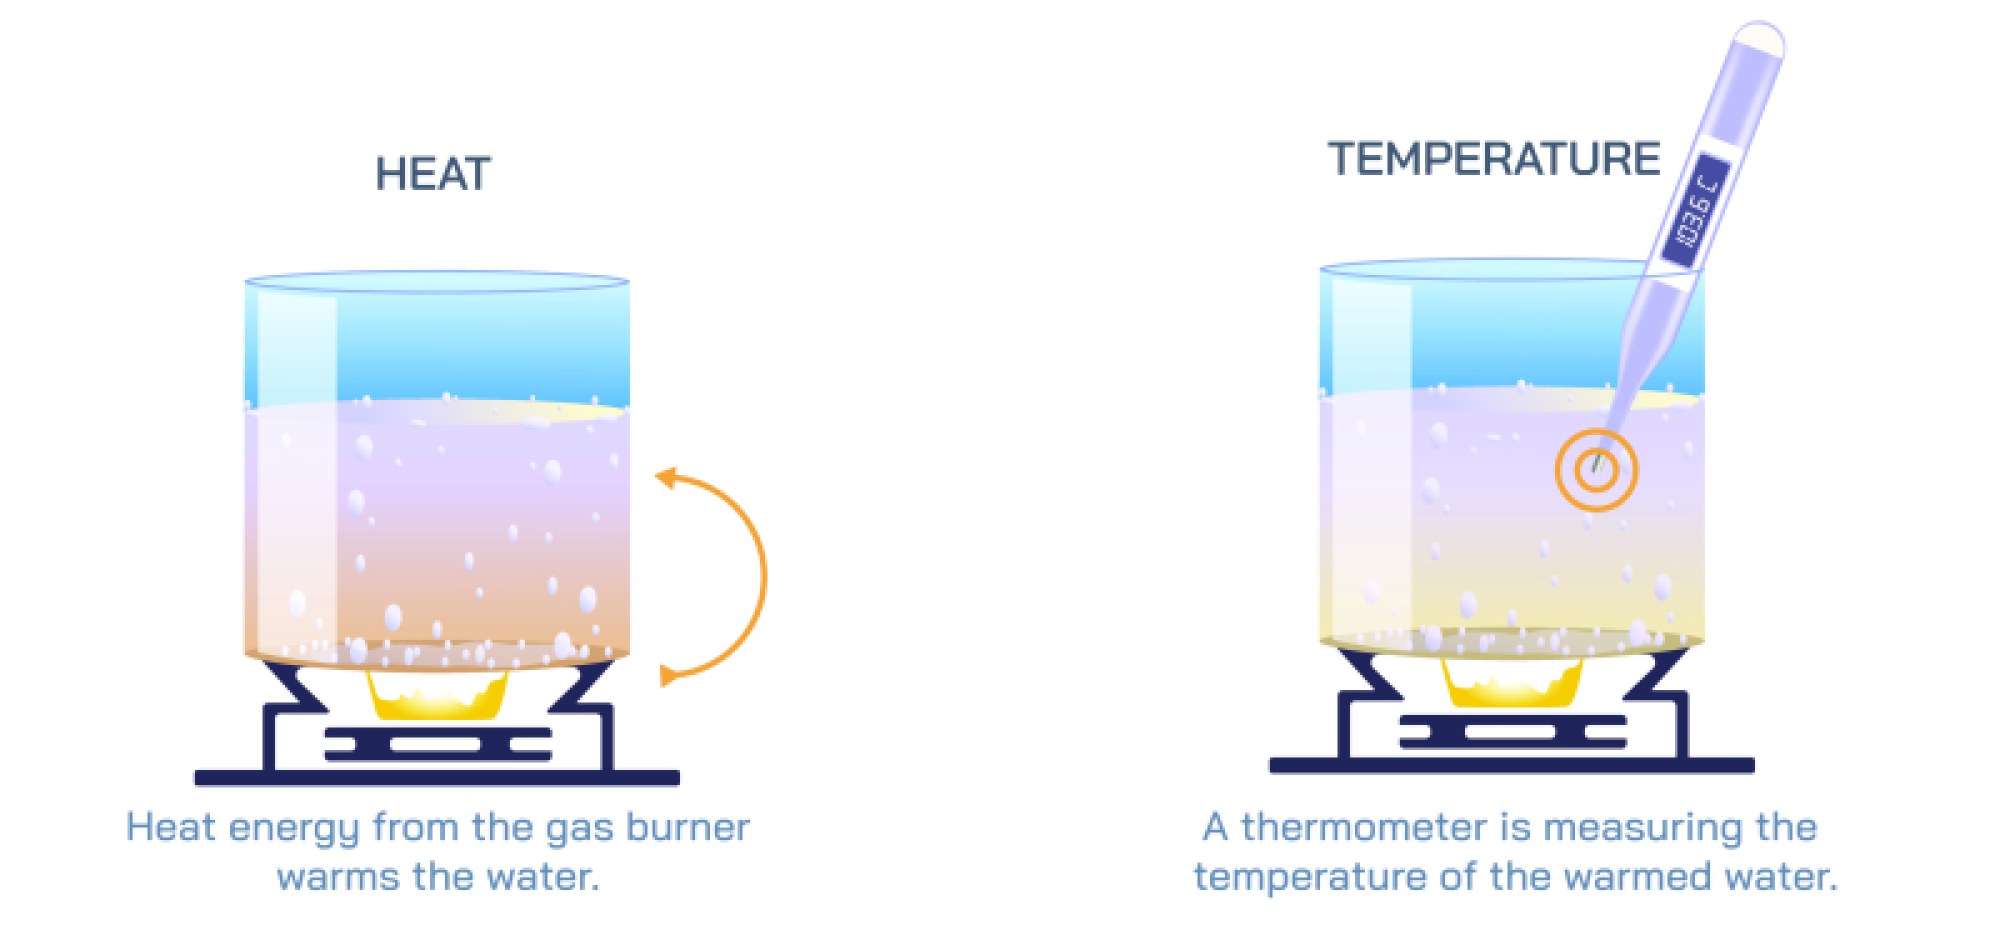
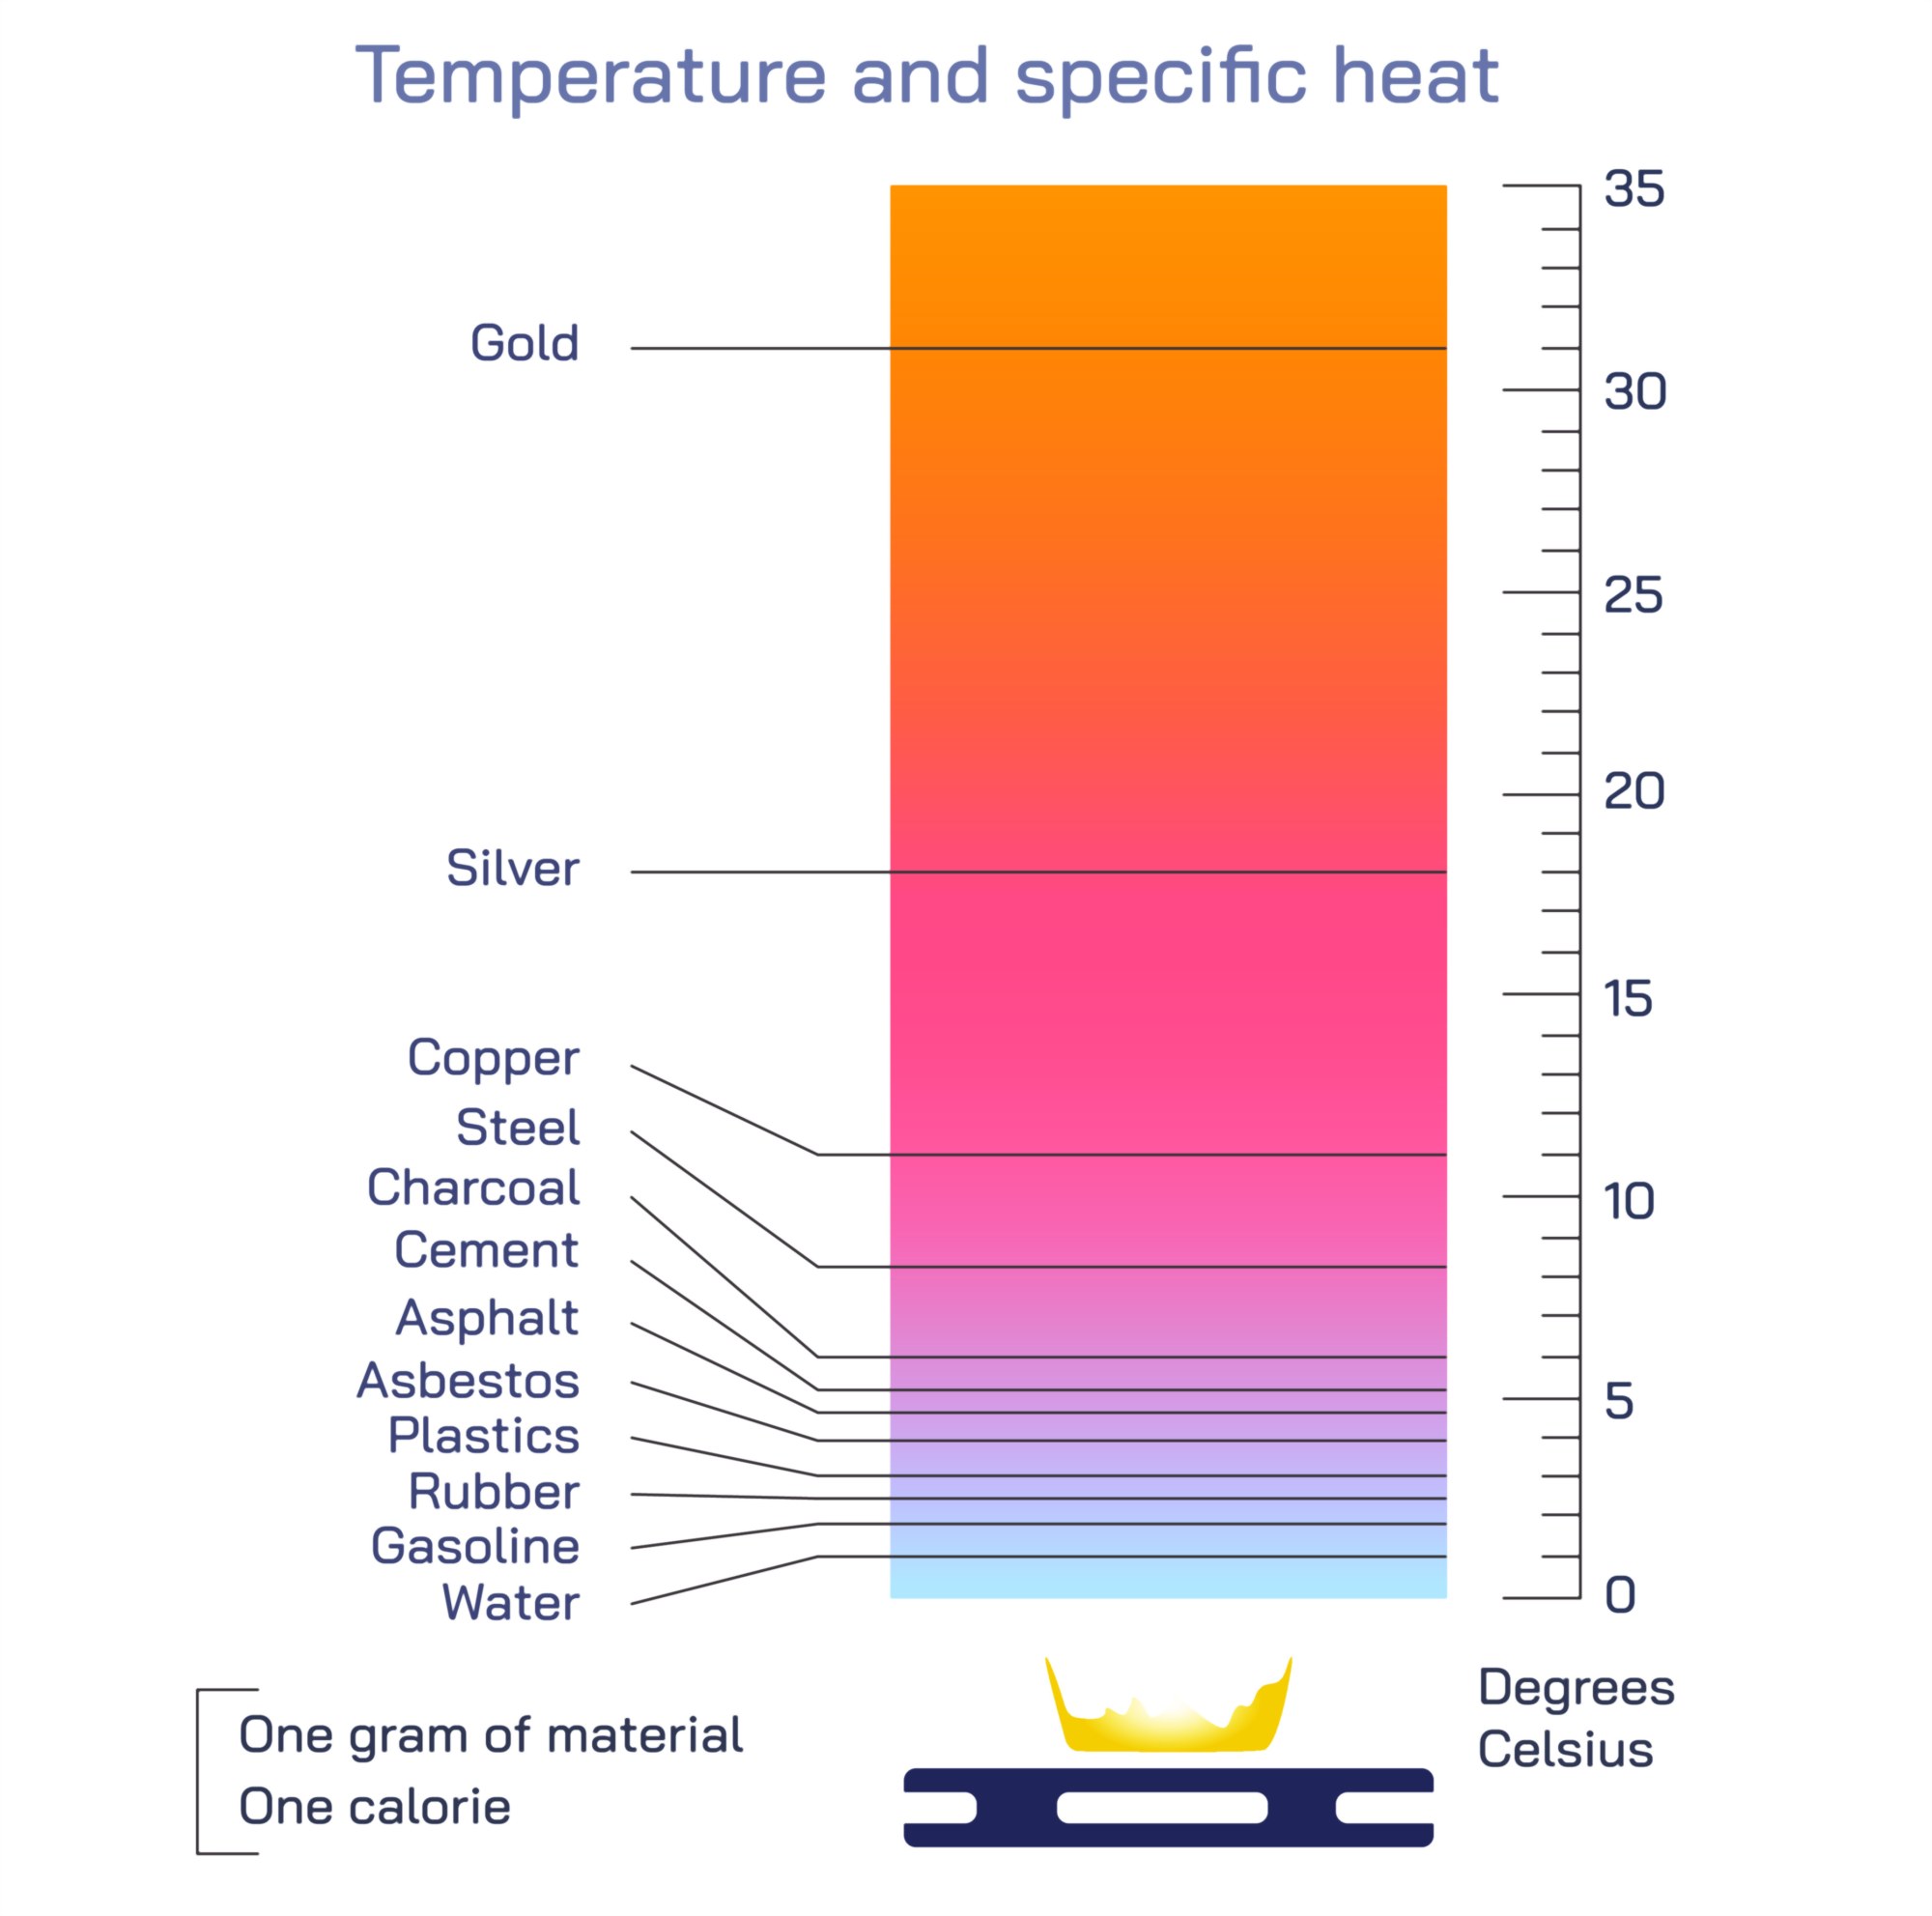
Where specific heat joins the illustration is in showing how different materials respond to the same thermal energy input. One of the most intuitive ways to depict specific heat is through a comparison of energy storage capacity. For example, imagine two “energy bars” or “heat containers” next to two substances. The water has a thermal energy bar that fills rapidly but causes only a small rise in temperature; the metal has a thermal energy bar that fills more slowly but causes a steep rise in temperature. This mental illustration reveals that water absorbs much more energy before it feels hot, while metal stores far less before it becomes extremely warm. Another visualization shows two identical flames heating two materials. After a given amount of time, a thermometer in the metal registers a sharp temperature increase, while the thermometer in the water registers only a modest change. The flames are equal in intensity, yet their effect—temperature change—is drastically different because the capacity for storing heat energy differs among materials. The more energy required to raise a substance’s temperature, the higher its specific heat.
This illustration concept links naturally to everyday experiences. People often notice that beach sand becomes scorching hot under the sun while ocean water remains pleasantly cool. The air in a room may warm up quickly when a heater is turned on, but the furniture and walls take much longer to warm because their specific heat and thermal mass are greater than that of air. Cast iron pans heat rapidly on a stove but also cool slowly because they store heat effectively and release it gradually. These familiar experiences can also be translated into diagram form: the same sun shining on land and sea is represented by identical rays of energy, but the temperature of the land rises quickly while the water temperature lags far behind. This contrast expresses why coastal climates remain milder than inland climates; enormous bodies of water act as temperature stabilizers because of their high specific heat, storing and later releasing huge amounts of energy without dramatic temperature fluctuations.
In expanding the illustration further, it is helpful to show thermal energy and temperature as related but not identical concepts. A large container of warm water can contain far more total thermal energy than a small container of boiling water even though the latter is hotter. A diagram might show a huge reservoir of moderately warm water and a tiny cup of very hot water. The thermometer in the cup reads higher, indicating greater temperature; yet the energy bar assigned to the reservoir is many times wider and fuller, showing that the large volume holds far more total thermal energy. This comparison highlights the difference between “how hot something is” (temperature) and “how much thermal energy it contains” (total heat content). Students often find this particularly revealing because it explains why large bodies of matter—oceans, planetary crust, massive metal structures—are slow to heat and slow to cool. They do not resist temperature change because they lack energy, but because they store so much energy that their temperature shifts gradually.
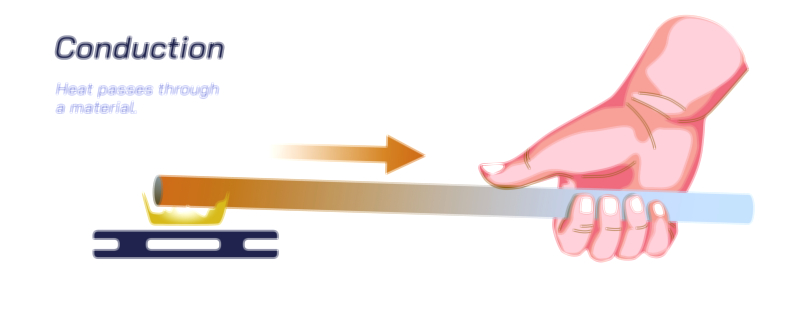
Illustrations of specific heat and temperature also help explain thermal equilibrium, the process by which two substances in contact eventually reach the same temperature. In a diagram, a hot block and a cold block are shown touching, with arrows representing heat flow moving from the hotter block toward the cooler one. At first, the hotter block may show fast-moving particles and high temperature; the cooler block shows slow-moving particles. As time passes, the particle speeds become similar, and the thermometers beside them stabilize at the same level. In an accompanying diagram focused on specific heat, two same-temperature blocks are placed in contact—one with high specific heat and one with low specific heat—and provided with heat. After the same energy input, their temperatures disagree again, showing that even if they began in equilibrium, their response to new energy is determined by specific heat. Temperature illustrates the state of each material; specific heat illustrates how the material changes state in response to energy.
Because heat capacity and specific heat are fundamental to engineering, environmental science, and daily technology, an illustration may extend into examples that visualize real-world consequences. Climate scientists refer to the ocean as a massive “thermal battery” because it absorbs solar energy far more efficiently than land. Engineers design cooling systems by selecting liquids with high specific heat to reduce overheating in engines, industrial equipment, and electronics. Cooking depends heavily on the thermal properties of materials—water takes long to heat but preserves moisture, metals heat quickly but cool rapidly when placed in contact with cooler materials. These examples demonstrate that the behavior of thermal energy is not abstract; it influences fields from meteorology to culinary science. Illustrations contrasting heating curves or showing material temperature response graphs help reinforce the idea that temperature change is a result of energy input filtered through the lens of specific heat.
A conceptual illustration may end by showing a visual continuum of materials ordered from lowest to highest specific heat—metals at one end, oils and rocks in the middle, and water near the top. This spectrum helps the viewer understand why substances respond differently to warmth from the Sun, from fire, from friction, or from electrical heating elements. The comparison communicates that specific heat is not just a label but an inherent thermal personality of matter—its tendency to either warm up quickly and cool down quickly or buffer temperature change and store energy deeply.
Together, an illustration of temperature and specific heat becomes a narrative about energy, motion, and resistance to change. Temperature captures what state a substance is in at a given moment—how vigorously its particles are moving. Specific heat reveals how stubbornly or gently a substance responds to heating or cooling—how much energy is needed to transform that motion. Thermal energy threads between them as the currency that converts microscopic particle motion into macroscopic thermal experience. Through visual comparisons, everyday examples, and intuitive descriptions of particle behavior, the concepts of temperature and specific heat emerge not as abstract physics terms but as vivid, accessible insights into how the material world warms, cools, stores energy, and releases it again in a continuous dialogue of motion and transformation.