Oxygen Transport in Blood in Graph: A Detailed Description
Understanding How Oxygen Transport Is Visualized Through Graphs
When studying how oxygen moves through the blood, the graph known as the oxygen–hemoglobin dissociation curve becomes one of the most powerful tools for understanding the efficiency of oxygen binding and release. The transport of oxygen does not occur randomly; rather, it follows a predictable pattern determined by the behavior of hemoglobin within red blood cells. This behavior reveals how oxygen attaches in the lungs, how it is carried through the bloodstream, and how it is delivered to tissues that need it most. Representing these processes visually in a graph allows for clearer interpretation of how the body adapts to exercise, altitude, illness, and shifts in internal chemistry. By examining the curve, one can see how hemoglobin responds to varying oxygen concentrations and how this response ensures that tissues receive oxygen precisely in proportion to their needs.
The Shape of the Oxygen–Hemoglobin Dissociation Curve and What It Means
The oxygen transport graph is typically an S-shaped curve that represents how much oxygen hemoglobin is carrying at different oxygen pressures within the blood. The curve begins in a region where oxygen levels are low, reflecting the conditions found in working tissues. In this part of the curve, even small changes in oxygen concentration lead to large amounts of oxygen being released from hemoglobin. This steep region ensures that muscles and organs can extract sufficient oxygen when their metabolic demands are high. As the graph rises toward the upper portion, the curve gradually flattens. This plateau represents the lungs, where oxygen pressure is high and hemoglobin becomes nearly fully saturated. Even if oxygen levels in inhaled air drop slightly, hemoglobin remains well-loaded, ensuring that arterial blood carries maximal oxygen.
How the Graph Explains Oxygen Loading in the Lungs
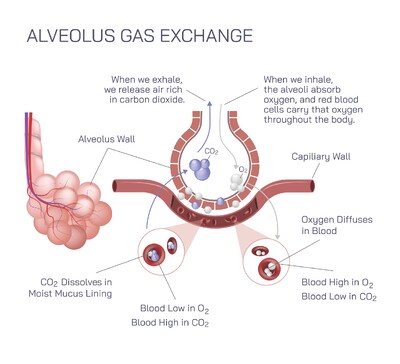
In the upper region of the curve, hemoglobin saturation approaches its maximum, indicating that nearly all binding sites are filled with oxygen. This visual representation highlights how effectively lungs transfer oxygen into the bloodstream under normal conditions. The plateau design shows that the body maintains high oxygen saturation even when oxygen availability slightly decreases, such as during mild respiratory illness or moderate altitude exposure. The graph reveals that the lungs provide a safety margin, ensuring the bloodstream remains rich in oxygen for distribution. This portion of the curve underscores the stability and reliability of the body’s oxygen-loading mechanism.
How the Graph Demonstrates Oxygen Delivery to Tissues
The lower portion of the curve is steep, which visually communicates hemoglobin’s remarkable ability to release oxygen efficiently when tissues need it. As blood enters metabolically active regions where oxygen levels are low, the graph shows hemoglobin rapidly transitioning from high saturation to lower saturation. This drop reflects oxygen being unloaded and transferred into cells. The steepness of this part of the curve reveals how responsive hemoglobin is to environmental conditions within tissues, allowing oxygen delivery to increase dramatically without requiring major changes in circulation. By reading the graph, one can easily understand how the body prioritizes oxygen supply in areas of high demand.
Factors That Shift the Curve and Their Meaning on the Graph
The oxygen transport graph can shift to the right or left depending on internal conditions, illustrating how the body adjusts to maintain oxygen balance. A rightward shift indicates that hemoglobin releases oxygen more readily, often due to increased temperature, higher carbon dioxide levels, or greater acidity in tissues. These conditions typically occur during exercise or metabolic stress, and the graph visually demonstrates how the body adapts by encouraging faster oxygen unloading. A leftward shift on the graph shows increased hemoglobin affinity for oxygen, meaning oxygen is held more tightly. This may occur in environments such as cold temperatures or decreased carbon dioxide presence. The graph thus becomes a dynamic tool, capable of revealing how internal changes affect oxygen transport without relying on complex explanations.
Why the Graph Is Essential for Understanding Physiological Adaptation
Representing oxygen transport through a graph allows students, healthcare professionals, and researchers to understand the respiratory system’s adaptability in a clear, accessible manner. The curve shows how the body maintains stable oxygen levels even when environmental conditions fluctuate. It demonstrates how exercise modifies oxygen delivery, how the body compensates during illness, and how respiratory disorders influence oxygen availability. The ability of hemoglobin to change its behavior depending on needs becomes visibly clear when interpreting the graph, highlighting the elegance and responsiveness of the human body’s oxygen-carrying system.
The Relationship Between Graph Behavior and Real-World Body Function
When the oxygen saturation is plotted against oxygen partial pressure, the resulting curve serves as a visual reflection of the balance between oxygen loading and unloading that governs everyday life. In moments of rest, the blood leaving tissues shows moderate saturation, illustrating a consistent supply of oxygen reserve. During intense physical effort, tissue oxygen levels drop significantly, and the curve’s steep descent demonstrates how hemoglobin swiftly compensates by releasing much more oxygen. In high-altitude conditions, the upper plateau of the graph reveals how the lungs maintain high saturation despite reduced oxygen availability. Through these examples, the graph connects scientific concepts directly with real physiological responses.
Interpreting the Graph as a Window into Hemoglobin Behavior
At its core, the oxygen transport graph serves as a visual representation of hemoglobin’s unique cooperative binding properties. When one molecule of oxygen binds, the shape of hemoglobin changes in a way that encourages additional oxygen molecules to attach more easily. This cooperative behavior is reflected in the S-shaped nature of the graph. Conversely, when oxygen begins to detach, hemoglobin releases additional molecules more readily, facilitating rapid oxygen delivery to tissues. The graph makes these structural and functional changes understandable by illustrating how hemoglobin’s affinity varies across different oxygen levels.
Why Oxygen Transport Graphs Remain Central to Physiology
The oxygen–hemoglobin graph remains fundamental in medical and biological studies because it communicates a complex physiological process in an intuitive, accessible form. It simplifies the understanding of how oxygen is carried, how it is distributed, and how the body adjusts to changing circumstances. By visualizing the relationship between oxygen pressure and hemoglobin saturation, one gains a deeper appreciation for the precision of the respiratory and circulatory systems working together. The graph is more than a scientific figure; it is a map of human adaptability, illustrating how the body meets its energy demands through efficient use of oxygen transport mechanisms.