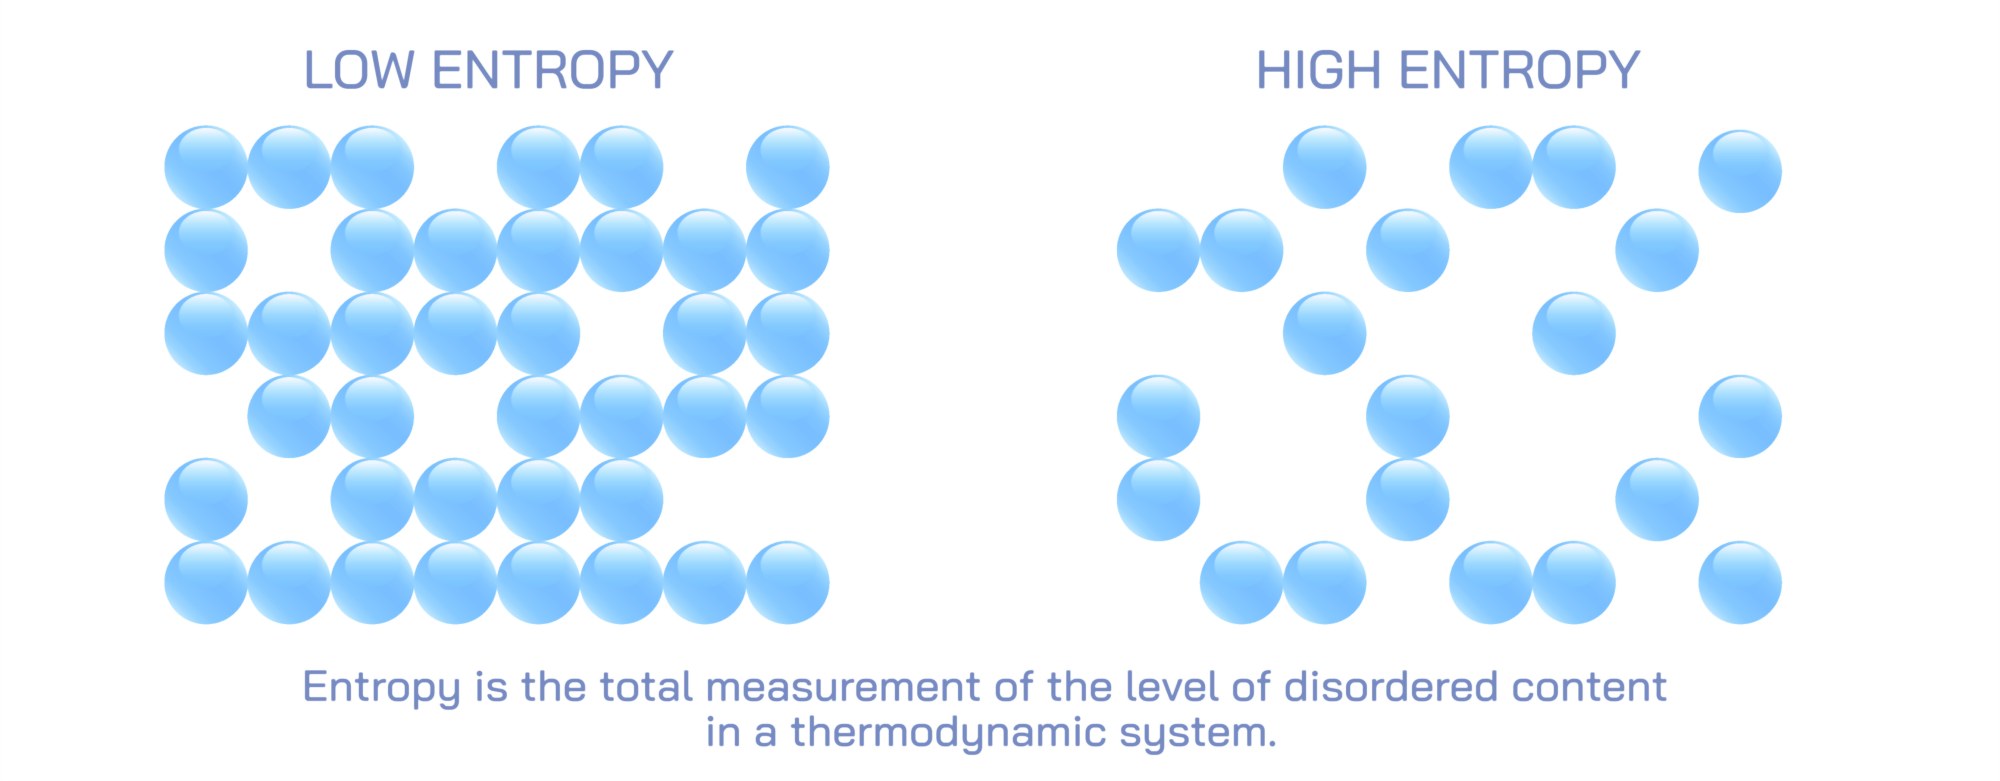
Low vs High Entropy Illustration: Order, Disorder, and Energy Distribution Explained
Entropy is a foundational concept in thermodynamics and statistical physics, describing the natural tendency of systems to evolve from order toward disorder and spread energy as evenly as possible throughout available space. Because entropy can feel abstract when expressed only as scientific terminology, an illustration comparing low entropy and high entropy provides a powerful visual way to understand how matter and energy behave over time. When ordered configurations are contrasted with disordered ones, and when energy concentration is compared to energy dispersal, the direction and meaning of entropy become intuitive.
Illustrations of low entropy typically depict highly ordered arrangements where components of a system are organized in a predictable and constrained manner. Imagine a box filled with colored molecules: a low-entropy illustration might show all the blue molecules clustered neatly in one corner, while the rest of the box is empty. Alternatively, diagrams may use rows of identical particles aligned in a tight grid, beads sorted by color, bricks stacked uniformly, or energy confined to one region. In these visuals, order is not just aesthetic—it shows that energy or matter is concentrated and restricted to fewer possible configurations. With so few ways to rearrange the system while keeping the same overall appearance, the state is statistically improbable. These illustrations communicate that low entropy reflects structure, constraint, and a system far from equilibrium.
Diagrams of high entropy, on the other hand, show disordered, randomized distributions. The same box of molecules that was organized neatly in one corner in the low-entropy example will now appear with particles scattered randomly across the entire volume. There is no predictable pattern, and all colors and positions appear mixed, representing energy dispersed and matter spread over the maximum possible space. Rather than a limited number of possible arrangements, a disordered system has countless microscopic configurations that look the same on a large scale. In thermodynamics terms, high entropy corresponds to equilibrium—a state in which no energy differences remain to drive work or directed change. Visually, the message is clear: when constraints disappear and randomness dominates, entropy rises.
A powerful feature of entropy illustrations is their ability to show change over time, revealing the natural direction of spontaneous processes. For example, hot red molecules might initially occupy one half of a container while cold blue molecules occupy the other. In low-entropy form, the separation is distinct and energy is concentrated. As time passes, arrows indicate diffusion—particles spread out, heat equalizes, and the system gradually becomes uniformly mixed. The final image represents high entropy: both colors—temperature and energy—distributed evenly. These visuals communicate the underlying principle that systems spontaneously evolve toward higher entropy without external intervention, because there are vastly more ways for particles to be randomly mixed than neatly separated.
Illustrations often extend beyond microscopic particles to everyday representations, demonstrating that entropy is not limited to gas molecules. A messy room, scattered books, and mixed puzzle pieces depict high entropy, while an organized desk, alphabetized library, or completed puzzle represent low entropy. These macroscopic analogies help translate an abstract concept into familiar experience. Without deliberate effort, systems move toward disorder, not because disorder is “preferred” in any intentional sense, but because there are simply more disordered states than ordered ones. These diagrams show why maintaining low entropy requires work.
In energy-based illustrations, the focus shifts to how energy spreads rather than how objects arrange themselves. A diagram might show a concentrated bundle of light or heat—low entropy—transforming into evenly distributed thermal energy—high entropy. In chemical or metabolic diagrams, high-energy molecules gradually degrade into simpler ones, releasing energy into the surroundings and increasing entropy. In astronomy illustrations, a dense gas cloud expands and thermally equalizes into uniform interstellar gas. These energy-centered pictures underscore that entropy is fundamentally about energy dispersal, whether in microscopic or cosmic systems.
Another powerful type of illustration compares local versus global entropy change, emphasizing that entropy can decrease locally while the total entropy of the surroundings increases. A diagram of a living cell is a classic example: inside the cell, complex molecules self-assemble into precisely ordered structures—low entropy locally. But this process releases heat and increases the entropy of the environment, ensuring that the total entropy of the system-plus-surroundings still rises. Illustrations often show heat or energy arrows leaving the cell or organism, symbolizing the outward increase in entropy that allows biological order to exist and be maintained. These visuals clarify why entropy does not prevent life from forming; rather, living systems maintain order by exporting entropy into their surroundings.
Educational charts also pair entropy with the Second Law of Thermodynamics, visually showing that:
• Low entropy → organized, energy concentrated, fewer microstates
• High entropy → disorganized, energy dispersed, many microstates
• Spontaneous processes increase total entropy over time
Time-lapse illustrations strengthen this connection by showing a one-way arrow of change—from order to disorder—except when external work is applied to reverse entropy locally. For example, an illustration of melting ice demonstrates that a crystalline solid (low entropy) transforms into liquid water (higher entropy) as molecules become more mobile and disordered. A parallel diagram of water freezing shows that lowering temperature and removing energy reverses the process, reducing entropy through work (heat extraction).
Entropy illustrations branch into information theory when demonstrating how disorder relates to uncertainty. In this context, low entropy corresponds to predictable data (e.g., a repeated letter sequence), while high entropy corresponds to random data (e.g., unpredictable, evenly distributed characters). This bridge between thermodynamics and information reminds viewers that entropy reflects uncertainty and possibilities—whether in particle positions or in data structure.
Ultimately, an illustration comparing low and high entropy makes an invisible thermodynamic principle visible and intuitive. It shows that order requires energy, randomness is statistically favored, and all natural systems—cosmic, chemical, physical, biological, and informational—move toward increasing entropy unless work is applied to maintain structure. By contrasting concentrated and dispersed energy, grouped and scattered matter, organization and chaos, such diagrams reveal entropy not just as a technical term, but as a universal rule guiding change throughout the physical universe.