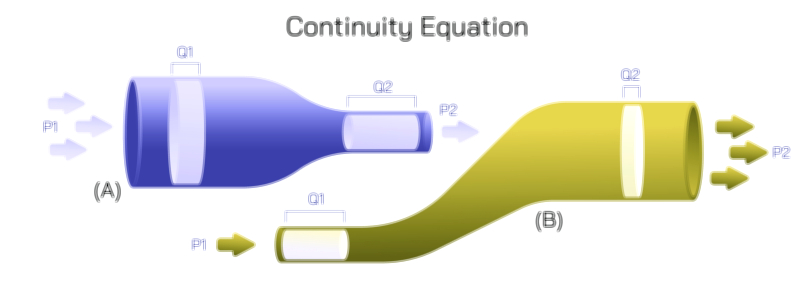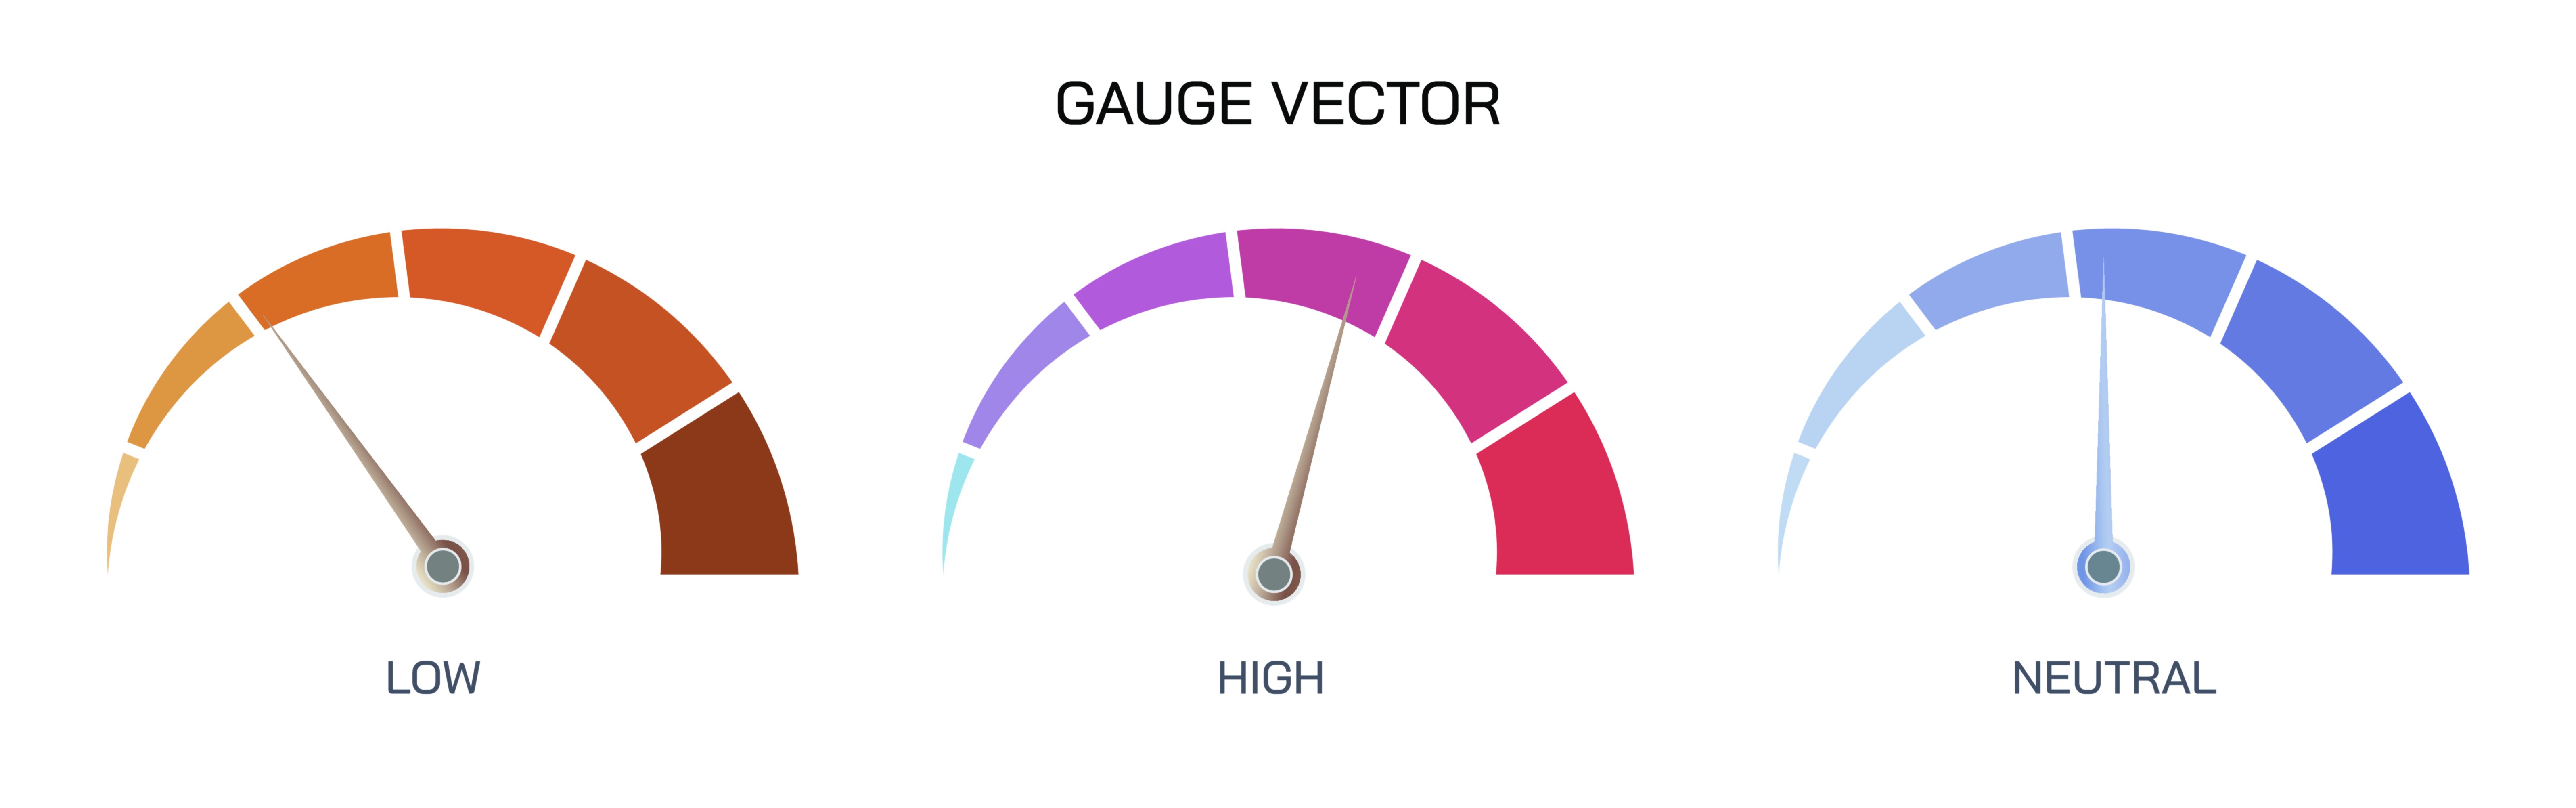
Gauge Vector Illustration Showing Measurement Dial, Pressure Indicator, and Scale Reading Concept in Engineering
A gauge is an essential instrument in engineering and industrial applications, used to measure, monitor, and display various physical quantities such as pressure, temperature, voltage, or mechanical force. A vector illustration of a gauge typically emphasizes the measurement dial, needle indicator, numerical scale, and pressure markings, providing a clear representation of how readings are obtained and interpreted. Such diagrams help engineers, technicians, and students understand the functional components of gauges, how physical quantities are translated into visual measurements, and the principles behind accurate instrumentation. By visualizing the gauge, the illustration bridges theoretical understanding with practical engineering applications.
At the center of the vector illustration is the measurement dial, often circular, which forms the interface for reading the quantity being measured. The dial is marked with evenly spaced divisions or gradations corresponding to the measurement scale. For a pressure gauge, these markings typically represent units such as psi (pounds per square inch), bar, or Pascal, allowing the user to quantify the applied pressure. The illustration may include labels for minimum, maximum, and mid-range values, with prominent markers for critical thresholds. Color coding, shading, or bold lines can highlight specific ranges, such as safe operating limits, warning zones, or critical levels, providing an immediate visual reference for operational safety.
A central feature in the gauge illustration is the needle or pointer, which rotates around the dial to indicate the current measurement. Arrows or vector lines may depict the direction of movement of the needle, while labels indicate the current reading on the scale. The needle is mechanically linked to a sensing mechanism within the gauge, which converts the physical input—such as fluid pressure in a pipe—into a rotational displacement. In vector diagrams, this connection may be illustrated with simplified internal components, such as a Bourdon tube, diaphragm, or bellows, showing how mechanical deformation produces needle movement. This visual cue emphasizes the direct relationship between the physical quantity being measured and the visual display on the dial.
The scale reading concept is integral to understanding gauge operation and is often highlighted in vector illustrations. For example, the dial may display evenly spaced numerical increments, and a close-up section of the dial can be included to show how the needle aligns precisely with scale divisions. This helps viewers understand that accurate readings depend on the calibration of the scale, the sensitivity of the pointer, and the precision of the gradations. Labels or magnified insets can show intermediate readings between major divisions, illustrating the concept of interpolating between marked units to obtain an accurate measurement.
In addition to the dial and needle, a vector illustration may depict sensing and input mechanisms. For a pressure gauge, the illustration might show a Bourdon tube, which bends under pressure, translating the linear displacement into rotational motion of the needle. Alternatively, a diaphragm gauge can be depicted, where pressure-induced deflection of a diaphragm is mechanically or electronically linked to the pointer. Arrows may indicate the flow of pressure or mechanical force from the input connection to the sensing element, helping viewers understand the transformation of physical energy into a readable dial movement. Color gradients or motion lines can enhance comprehension of these mechanical interactions.
Vector illustrations often include reference indicators, such as zero marks, maximum allowable pressure, and safe operating ranges. These may be represented as colored zones—green for safe, yellow for caution, red for danger—providing intuitive visual cues for engineers monitoring the system. Additionally, in digital or hybrid gauge designs, vector diagrams may show a secondary display for numerical readings alongside the analog dial, integrating traditional and modern measurement approaches.
A comprehensive illustration also demonstrates the direction of pressure or measurement input. For a fluid pressure gauge, arrows may indicate the connection to a pipe or vessel, showing how the medium enters the sensing element. Labels may specify inlet and outlet connections, flow direction, or mounting orientation, emphasizing practical aspects of installation and operation. For other types of gauges, such as torque or force gauges, vector arrows can depict the applied mechanical force and the resulting needle deflection.
The vector diagram may also explain engineering applications. For example, pressure gauges are critical in systems such as hydraulic circuits, steam boilers, gas pipelines, and industrial machinery. By including labeled contextual elements like pipes, tanks, or machinery components, the illustration links the gauge’s function to real-world operational scenarios, demonstrating how monitoring and controlling physical quantities ensure system safety and efficiency.
By integrating the measurement dial, needle indicator, scale reading, and sensing mechanism, a gauge vector illustration provides a clear and complete understanding of how the instrument functions. It emphasizes the translation of physical quantities into readable visual indicators, the importance of scale calibration, and the interpretation of the reading in practical contexts. Color coding, arrows, and magnified sections enhance comprehension, showing both macroscopic display and internal mechanisms.
Ultimately, the vector illustration communicates that a gauge is not merely a dial but a sophisticated device that converts physical phenomena into precise measurements. It visually bridges the connection between mechanical, fluid, or electrical inputs and the readable output, demonstrating the principles of engineering measurement, monitoring, and safety. By combining structure, function, and application, the diagram provides a comprehensive tool for understanding the operation and significance of gauges in engineering systems.