Crude Oil Growth – Economic Expansion, Investment Trends, and Global Financial Influence
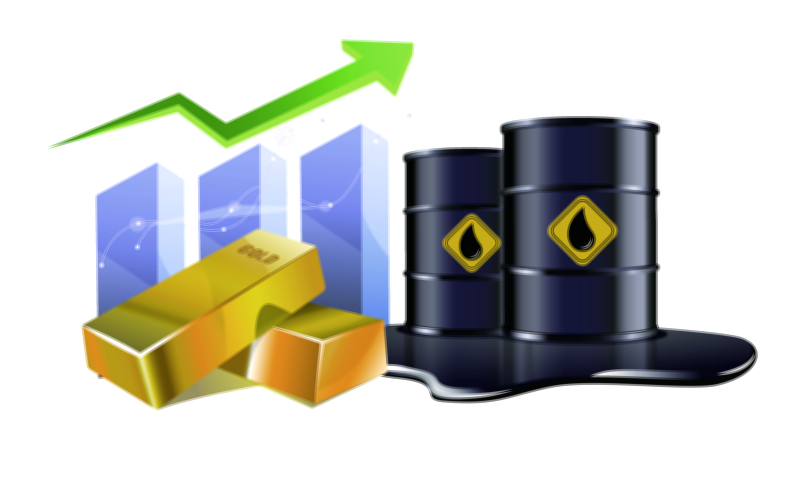
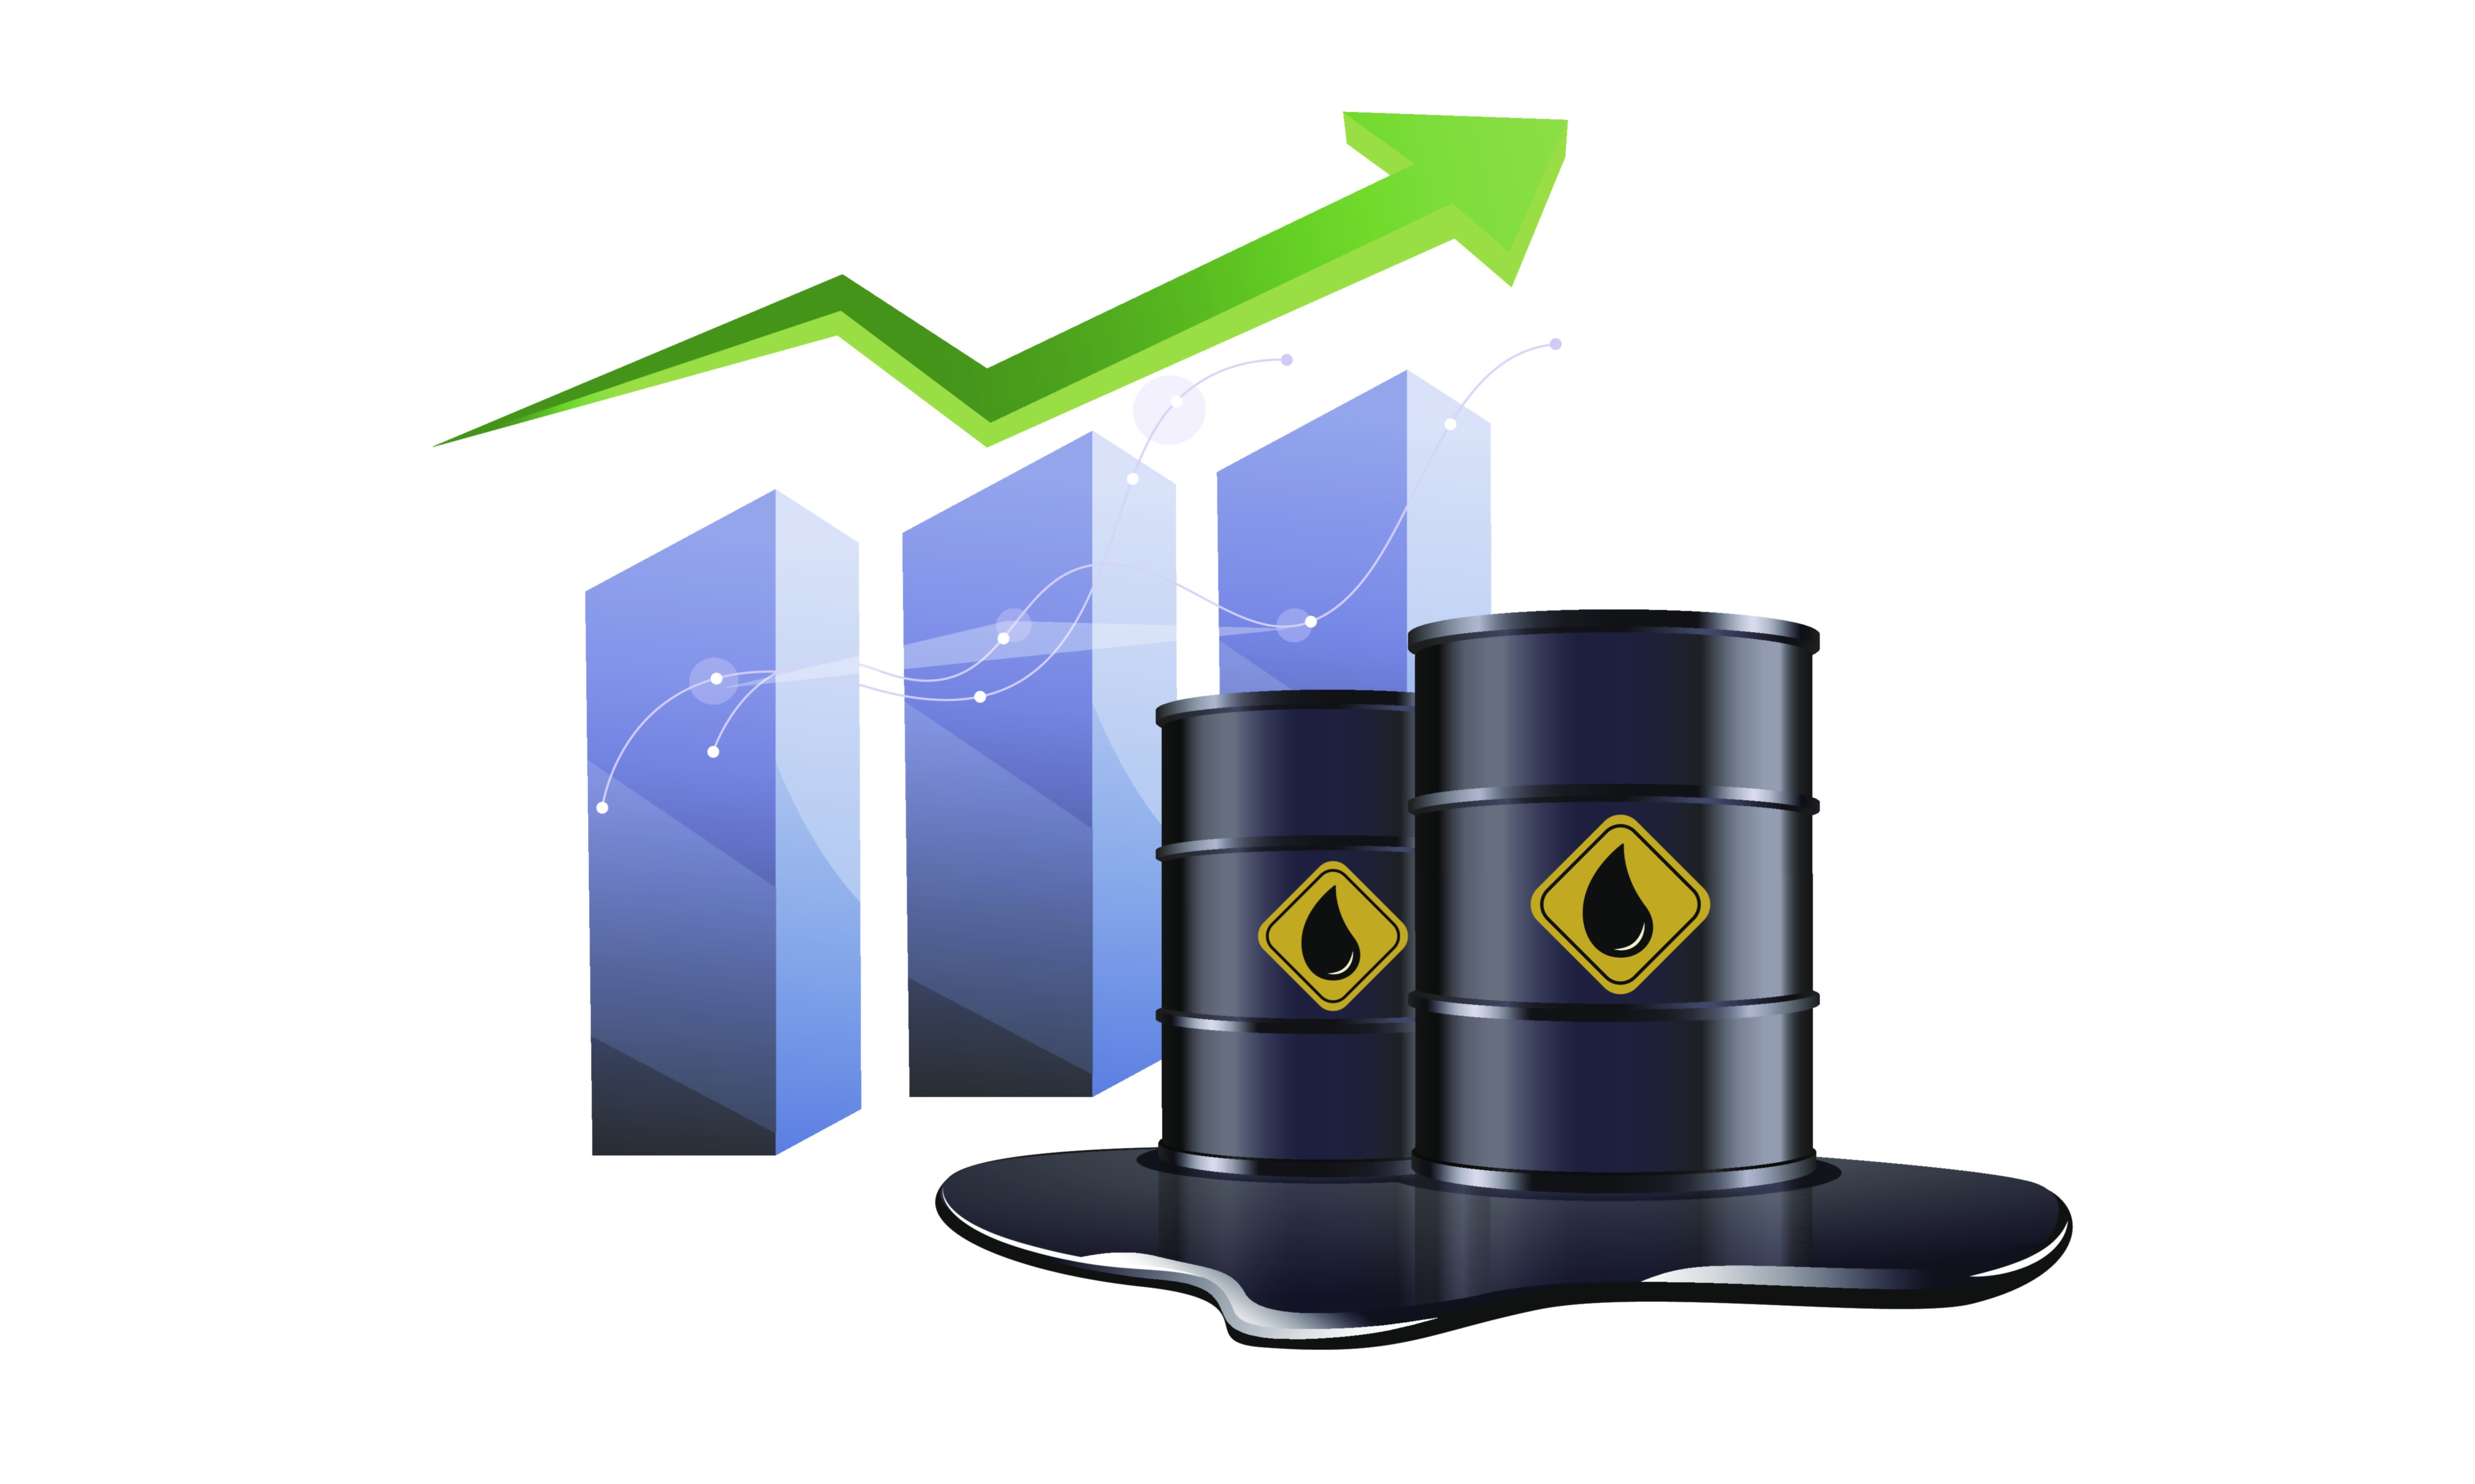
Crude oil growth stands at the heart of modern economic development because it reflects the level of industrial activity, global transportation needs, energy consumption patterns, and manufacturing strength, making it not only a commodity but a real-time pulse of worldwide economic momentum. When portrayed visually in a vector illustration, crude oil growth is usually symbolized through rising price arrows, bullish market charts, oil barrels expanding in quantity, refinery towers outputting energy, and sometimes global maps that highlight interconnected trade routes. These visual elements are not simply artistic expressions — they illustrate a complex economic story, one in which crude oil operates as both the driver and an indicator of prosperity. The steady upward motion in such illustrations communicates more than just financial gain; it implies business acceleration, job creation, global logistics expansion, and heightened consumer demand. Because crude oil fuels industrial machinery, marine trade, aviation networks, and freight transportation, its growth reflects the operational strength of entire national and international systems. Whenever demand for oil climbs, it is because the world is moving faster — factories produce more, people travel more, goods circulate more, and supply chains work harder. Therefore, crude oil growth becomes symbolic of the strength of economies and the confidence of markets.
What makes crude oil particularly influential in investment trends is the way it mirrors global development cycles. When nations expand their infrastructure, build new cities, construct industrial zones, and upgrade power systems, they inevitably increase hydrocarbon demand. As more consumers purchase vehicles, as airlines expand their fleets, as petrochemical industries scale production of plastics and synthetic goods, and as shipping volumes rise to meet trade needs, crude oil consumption increases accordingly. This creates a rising cycle of investment opportunity because oil prices move upward when consumption exceeds supply, and oil-linked assets tend to gain momentum during such phases. Businesses operating in exploration, drilling, transportation, refining, and petrochemical manufacturing benefit from this trend, which is why crude oil growth influences not only the price of petroleum but broader stock markets. Energy companies often act as lead indicators of economic strength; when their earnings rise, it usually signals that expansion and industrial optimism are underway. In a vector illustration, this synergy appears through upward price curves, refinery silhouettes, and positive investment arrows — a visual cue representing the narrative that oil growth and economic momentum rise hand-in-hand.
However, crude oil growth is not merely a function of consumption but also a reflection of geopolitical events and production dynamics. Decisions by large oil-producing nations to cut or increase supply can send prices soaring or tumbling within days. Political tensions in oil-rich regions, disruptions caused by natural disasters affecting major refineries, sanctions on exporting countries, or breakthroughs in drilling technology can radically alter market expectations. Investment trends therefore evolve in response to a combination of demand-driven expansion and supply-driven volatility. For investors, this volatility is not necessarily a drawback — rather, it introduces trading opportunities that reward those who understand the interplay between economics and geopolitics. When shown in a vector graphic, this dimension is sometimes represented by fluctuating price lines that eventually rise upward, demonstrating that short-term uncertainty often gives way to long-term upward cycles as the world continually requires more energy to sustain development. Because oil markets never remain static, investment strategies that rely on crude oil must respect both momentum and unpredictability, transforming volatility into an analytical advantage instead of a source of fear.
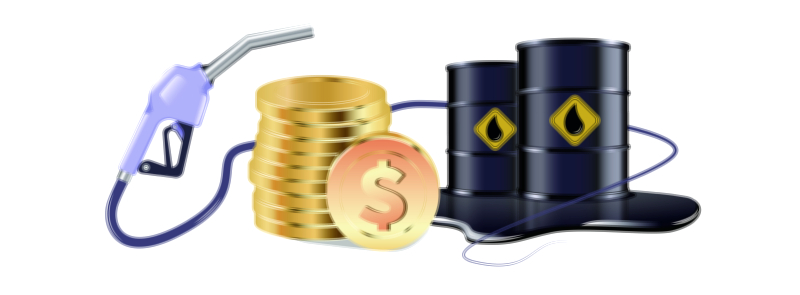
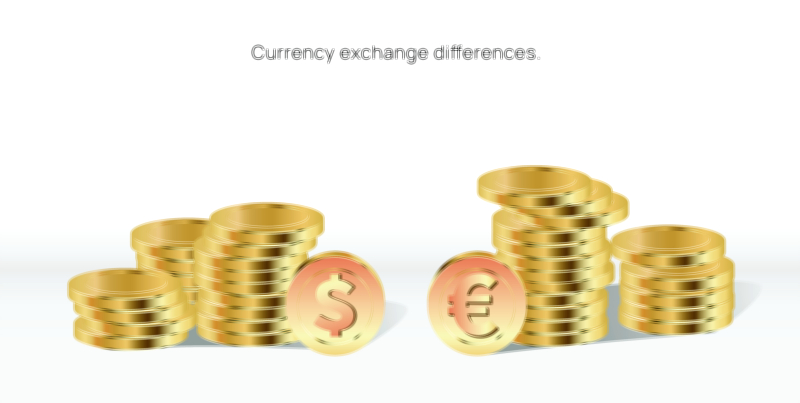
Crude oil growth also reshapes global financial patterns through its direct connection to inflation, currency values, and government budgets. Countries that rely heavily on oil imports often face inflationary pressure when crude prices rise because transportation and manufacturing costs spill into consumer prices. Conversely, oil-exporting countries experience economic surges when crude prices climb, allowing them to strengthen national budgets, increase public investment, and expand financial reserves. Such macroeconomic ripple effects influence investor decisions because the growth of oil can determine whether certain economies outperform others. Investment funds specializing in emerging markets, global equity portfolios, and commodity-linked mutual funds all adjust allocations according to trends in the oil markets. In this sense, crude oil growth is as much a currency indicator as it is a commodity event. The vector illustration of crude oil growth — rising barrel stacks, bullish arrows, and global outlines — becomes a concise representation of this financial and geopolitical web, teaching viewers that oil is not simply an industry but a foundation of global economic power.
The psychological component of investment trends plays a key role as well because market confidence rises when oil prices grow steadily without excessive volatility. Investors interpret such consistency as a sign that industries are functioning smoothly, trade is stable, and consumer demand is healthy. When the price of oil reflects supply-demand balance rather than disruption, financial optimism spreads. This optimism drives investment in oil-related stocks and ETFs, increases participation in commodity futures markets, and strengthens institutional and retail belief that the global economy is in an expansion phase. Visual financial graphics attempt to capture this sentiment through bright colors, upward trend lines, and stability indicators — the vector illustration becomes a narrative of confidence. In digital investment platforms, blogs, financial dashboards, and presentations, such imagery helps simplify complex macroeconomic behavior, allowing even beginner investors to understand how crude oil growth influences broader financial sentiment.
It is also important to acknowledge that the narrative of crude oil growth does not exist in isolation from the global energy transition toward renewables. While many nations are adopting cleaner energy sources, crude oil remains indispensable to aviation, shipping, heavy industry, petrochemicals, pharmaceuticals, transportation logistics, and agricultural mechanization. Rather than disappearing, oil demand has shifted toward more specialized industrial needs while renewable energy grows in the power-generation space. Investors recognize that the global economy is entering a hybrid era in which oil growth continues due to industrial necessity even as the world prepares for a cleaner future. In vector graphics explaining investment strategy, we often see oil symbols paired with digital-era imagery — like data graphs and automated trading arrows — to communicate that crude oil investment has shifted from traditional physical business operations to modern market integration. Oil now plays a dual role: a physical industrial driver and a digital financial instrument.
Ultimately, crude oil growth, when viewed through the lens of economic and investment trends, becomes a roadmap of how societies evolve. It shows when production rises, when trade strengthens, when industry innovates, and when consumer lifestyles scale upward. Investors use this signal not only to profit but to understand economic direction. They learn that oil growth is not just about barrels and rigs; it is about jobs, factories, mobility, global logistics, energy security, investor confidence, and the financial stability of nations. A Crude Oil Growth Vector Illustration compresses all of this into a visual message. The upward arrows imply progress, the expanding oil barrels symbolize industrial force, and the market chart suggests rising investment opportunity — together creating a universal language of economic expansion. It is through this symbolism that crude oil continues to occupy a central place in conversations about financial strategy, because as long as the world moves, evolves, builds, and trades, crude oil growth will remain intertwined with economic advancement and investment potential.