Gold and Crude Oil Price Growth – Market Signals, Investment Trends, and Economic Behavior Illustrated Through Dual Commodity Performance
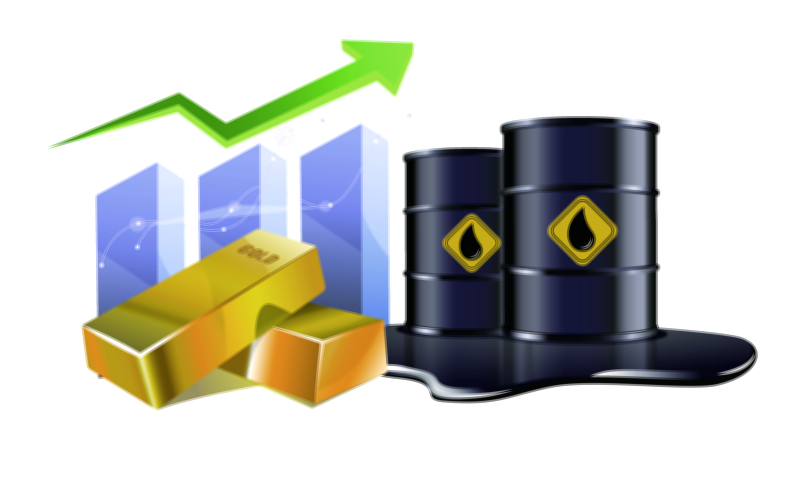
Gold and crude oil price growth together form one of the most revealing mirrors of global economic health because they reflect two contrasting dimensions of financial reality: industrial expansion and crisis-driven capital protection. When displayed in a vector illustration, these forces are often portrayed with upward bar charts, climbing arrows, gold bars stacked alongside expanding oil barrels, and market graph overlays that communicate the shared theme of rising value. Although gold and oil behave differently in financial cycles, a price growth illustration that places them side-by-side demonstrates the complex balance of fear and confidence that shapes markets. Crude oil price increases usually signal strong energy demand, active industry, and economic acceleration; gold price increases often point to inflationary pressure, declining confidence in fiat currencies, or uncertainty in financial markets. When both commodities rise simultaneously, the illustration points toward a unique moment in the financial world — one in which both economic activity and uncertainty are escalating together, forming a rare blend of opportunity and caution that investors interpret carefully. The visual becomes not only a depiction of price trends but a symbolic narrative of how markets think, react, and adapt to global forces.
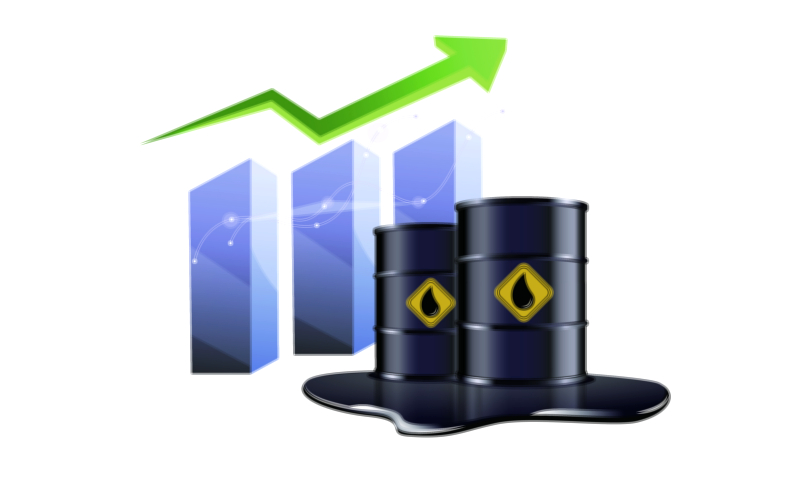
The relationship between gold and crude oil becomes clearer when viewed through the rhythm of economic cycles. During periods of robust business expansion, rising incomes and strong industrial output lead to higher energy consumption. Marine shipping, aviation travel, manufacturing output, electrical power production, mining operations, construction, and global logistics all intensify, driving crude oil demand upward and contributing to price growth. In such phases, investors enter oil-linked markets to ride the momentum of global progress. Crude oil stocks, drilling and exploration equities, energy-sector ETFs, and petroleum futures become attractive because they convert business confidence into profit potential. A vector illustration depicting expanding oil barrels and bullish arrows captures this “growth side” of financial behavior — the belief that the world is producing, consuming, building, and expanding. But at the same time, structural risks are always present. Inflation can rise as industry accelerates, interest rates fluctuate, geopolitical tensions influence supply chains, and governments struggle to manage exchange rates. These concerns awaken the psychological need for safety that drives investors toward gold.
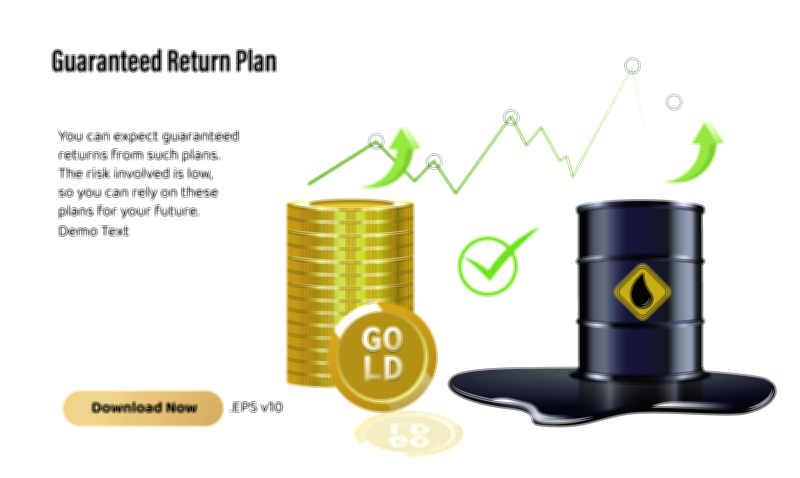
Gold price growth reflects that layer of emotional and economic caution. When inflation climbs, when currencies weaken under policy pressure, when debt burdens increase, when recessions threaten employment, or when geopolitical conflict challenges stability, investors rely on gold because it protects wealth independent of corporate earnings or government structures. A rising gold price does not mean the world is collapsing — it means uncertainty is rising and investors are proactively guarding their capital. When paired with crude oil in a vector illustration, gold appears as the stabilizing counterweight to aggressive economic expansion. This visual contrast — one asset rising due to progress and the other rising due to caution — tells a complex financial story without requiring a single word. It communicates that investors are preparing for growth while protecting against downturns, that financial optimism exists but is tempered by risk awareness, and that modern portfolios must balance opportunity with preservation rather than depend on a single outcome.
The synergy of gold and crude oil price growth becomes especially significant when both curves move upward at the same time. This pattern is often visible during phases of high inflation or geopolitical instability in which supply shortages drive crude oil prices upward while fear drives gold purchases simultaneously. Such a dual surge is not contradictory — it reflects a world where demand for energy remains strong while trust in financial stability weakens. Industrial sectors are functioning, but confidence in currency and policy is shaken. For investors, this dynamic indicates a powerful transition period that demands tactical thinking. A vector illustration showing both oil barrels and gold bars growing upward can represent not only upward pricing but a deep strategic lesson: markets are preparing for economic expansion that is expensive and unstable, leading investors to pursue both performance and protection. The rising lines in the illustration become symbolic of a portfolio design principle — success does not come from choosing growth or safety, but from understanding when to combine them.
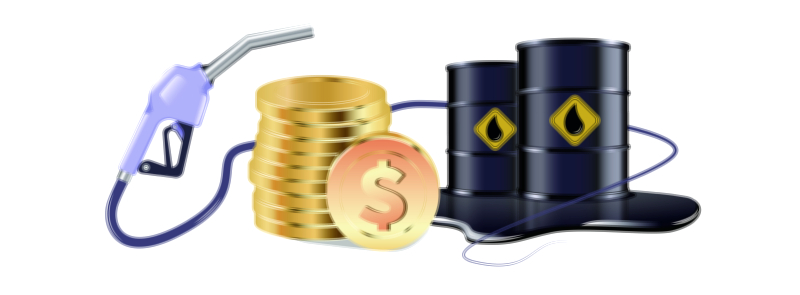
From an economic standpoint, the parallel growth of gold and crude oil shapes global policy decisions. Countries dependent on oil imports face heavy cost burdens when crude prices rise, intensifying inflation and driving central banks to raise interest rates. Higher interest rates can weaken growth and reduce corporate earnings forecasts, pushing investors toward gold even further. Conversely, oil-exporting countries benefit from surging crude prices, gaining increased revenue and the ability to invest more in infrastructure and public spending, influencing regional wealth distribution and currency strength. The growth of gold and oil together can cause a ripple effect that shapes currency performance, international trade, and governmental budget planning across entire regions. Vector illustrations that show both commodities climbing visually summarize these macro-economic linkages, turning complicated global patterns into a simplified visual cue that analysts, executives, economists, and investors can interpret rapidly.
The investment psychology reflected through such an illustration runs deeper than profit alone. Rising oil prices create excitement about industrial opportunity — the promise of growth, trade, and expansion. Rising gold prices create reassurance — the comfort that regardless of what happens next, something valuable remains secure. When both rise at the same time, the market sentiment becomes mixed but highly focused: investors seek growth while refusing vulnerability. This mindset drives capital into diversified portfolios containing oil ETFs, large-cap energy firms, gold funds, mining companies, and physical bullion. It stabilizes portfolios during volatility and accelerates performance during booming cycles. For beginners, the illustration acts as a teaching tool about the balance between ambition and caution; for professional traders, it becomes a forward-looking indicator of investor emotion. In both cases, the chart is a bridge between logic and instinct — two forces that shape every financial decision.
The vector format of a gold-and-crude-oil price growth illustration is crucial because clarity determines comprehension. Data visualization loses impact when blurred or pixelated, particularly on financial dashboards, digital reports, investment apps, and marketing presentations. A vector graphic preserves precision, ensuring that every price bar, upward arrow, and commodity icon remains sharp whether viewed on a small smartphone screen or projected on a conference auditorium display. This visual perfection strengthens credibility because financial audiences associate visual clarity with analytical reliability. A crisp upward-rising vector chart reinforces confidence in the message — the business or investment insight is supported by unmistakable visual growth.
Beyond numbers, the emotional takeaway of such an illustration is powerful. Investors who see both oil and gold trending upward simultaneously feel the weight of history: economies move forward, energy demand rises, but uncertainty always shadows prosperity. Those who invest with awareness understand how to position their capital so that neither optimism nor fear dominates their decisions. True investment maturity comes from accepting that both forces coexist — growth requires energy, and wealth needs protection.
In summary, a Gold and Crude Oil Price Growth Vector Illustration for Market and Investment Trends is much more than a graphical design; it is a visual expression of global financial behavior. The climbing gold bars represent security in uncertainty. The expanding oil barrels represent momentum in progress. Together, they show that the strongest investment mindset is not limited to bullishness or defensiveness but is rooted in the ability to navigate both. As long as the world continues to build, trade, innovate, and face challenges, crude oil and gold will rise and fall in patterns that guide investors toward the same core truth — successful financial strategy is built on the balance of opportunity and protection, ambition and caution, performance and preservation.