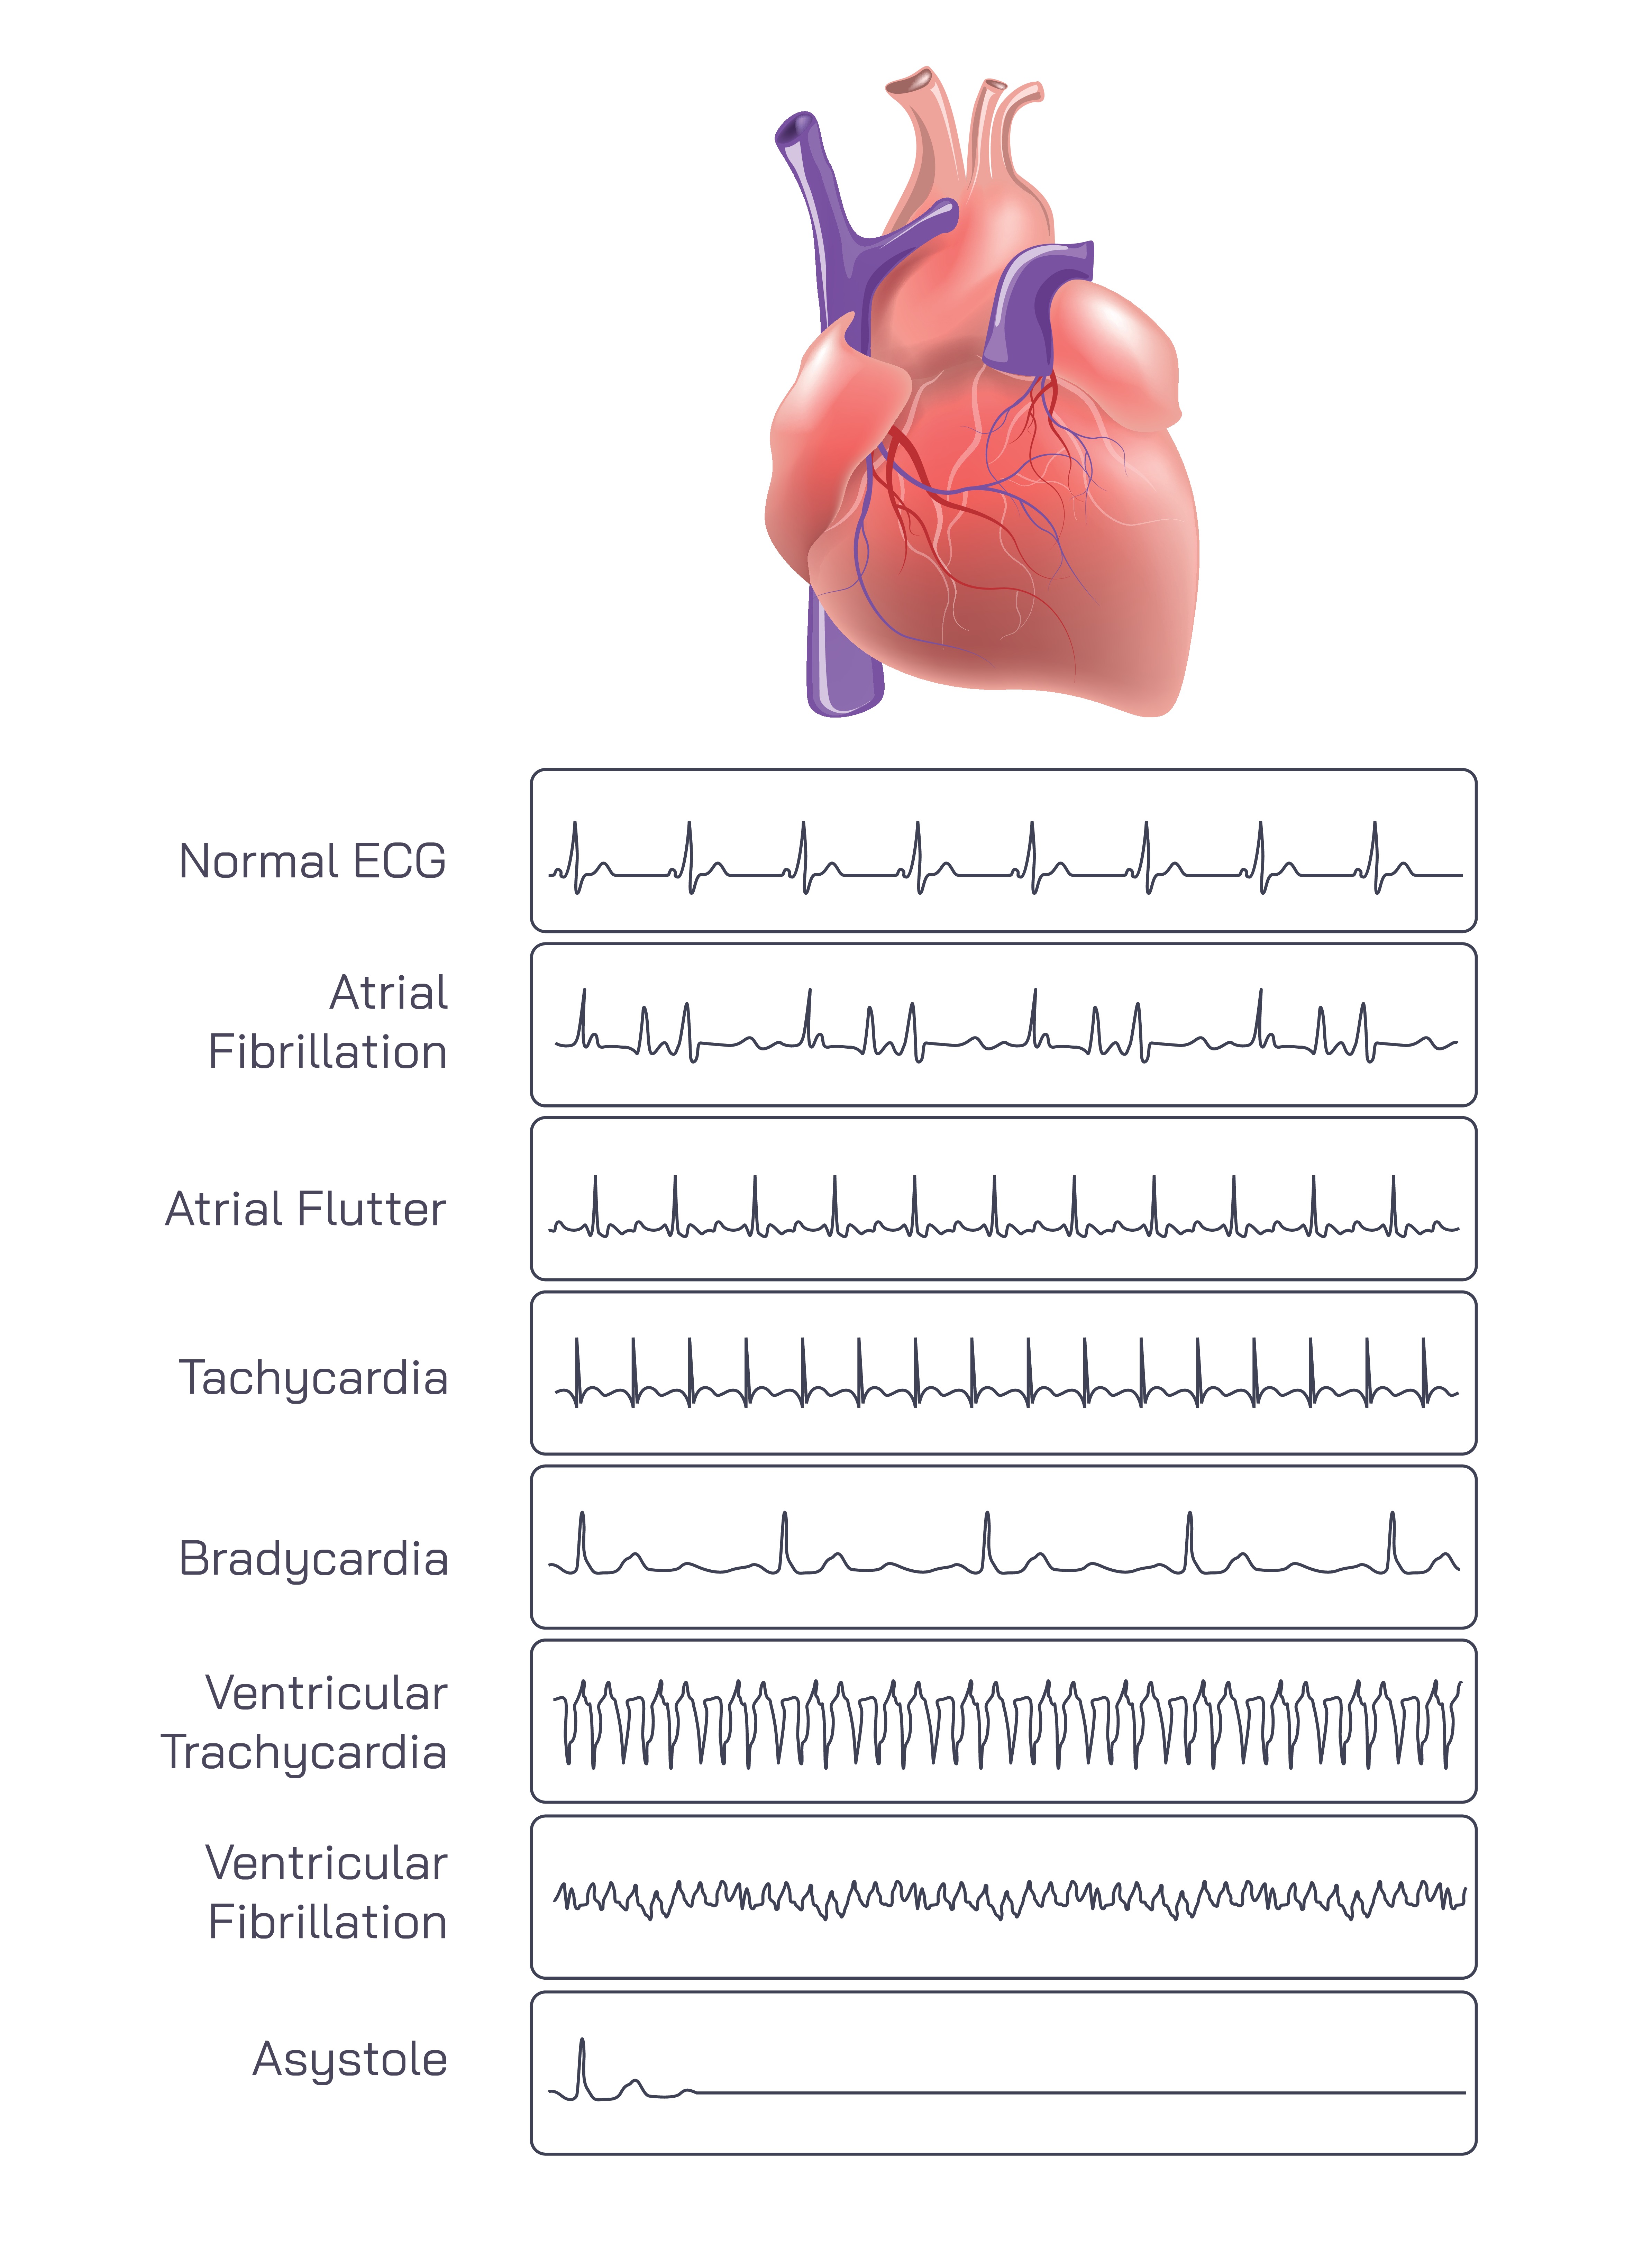
Types of Heart Rate Patterns Displayed in ECG Graphs: A Detailed Description
Understanding Why ECG Graphs Reveal Heart Rhythm Patterns
Electrocardiography (ECG or EKG) is one of the most important diagnostic tools in cardiology because it captures the electrical activity of the heart as a continuous waveform. Each heartbeat results from a coordinated electrical impulse that triggers muscle contraction in the atria and ventricles. When the rhythm becomes irregular, too fast, too slow, or chaotic, the ECG tracing visibly changes. These changes help medical professionals interpret the type of arrhythmia and how it affects heart function. By analyzing the shapes, intervals, and frequency of waves, clinicians can detect life-threatening conditions, monitor chronic issues, or confirm normal cardiac activity.
Normal ECG: A Stable, Regular Heartbeat Pattern
A normal ECG shows a consistent and repeating waveform pattern that represents the synchronized activity of the heart. The P wave marks atrial contraction, the QRS complex represents ventricular contraction, and the T wave shows ventricular recovery. These waves appear evenly spaced, reflecting a steady, healthy heart rhythm. A normal ECG indicates balanced electrical conduction and efficient pumping of blood throughout the body. This pattern serves as the reference point against which all abnormal rhythms are compared.
Atrial Fibrillation: Chaotic, Irregular Electrical Activity
Atrial fibrillation (AFib) is characterized by extremely irregular baseline activity and erratic spacing between heartbeats. Instead of a well-formed P wave, the tracing displays rapid, chaotic electrical impulses coming from multiple areas of the atria. The ventricles respond irregularly, causing an unpredictable heartbeat. AFib disrupts normal blood flow through the atria and increases the risk of clot formation. On an ECG, the hallmark of atrial fibrillation is its “irregularly irregular” rhythm, where no two intervals look the same.
Atrial Flutter: Rapid, Sawtooth-Like Pattern
Atrial flutter occurs when the atria contract rapidly and regularly, producing a distinct sawtooth appearance on the ECG. These flutter waves (called F waves) appear at a much faster rate than the ventricular contractions, creating a repetitive and recognizable rhythm. Even though the atria beat quickly, the ventricles often respond at a slower, more controlled rate. The pattern is more organized than atrial fibrillation but still indicates abnormal electrical looping in the atria.
Tachycardia: A Fast, Regular Heart Rhythm
Tachycardia refers to a heart rhythm that is faster than normal, typically exceeding 100 beats per minute at rest. On an ECG, the interval between beats is shortened, causing the waveform to appear compressed. Although the waves maintain their typical shapes, they occur more frequently. Tachycardia can result from exercise, fever, stress, or underlying heart issues. Depending on the cause, the rhythm may be harmless or require medical evaluation.
Bradycardia: A Slow, Regular Heart Rhythm
Bradycardia is the opposite of tachycardia—a slow heart rate under 60 beats per minute. The ECG tracing shows broader spacing between beats, reflecting less frequent electrical impulses. Despite being slow, the rhythm may still be stable and normal, especially in trained athletes. However, pronounced bradycardia can also signal issues such as heart block or malfunction of the sinus node. The ECG helps determine whether the slow rhythm is healthy or concerning.
Ventricular Tachycardia: Dangerous, Rapid Ventricular Rhythm
Ventricular tachycardia (VT) is a serious arrhythmia where the ventricles beat rapidly and independently from the atria. The ECG shows broad, repetitive QRS complexes with a very fast rate. This pattern disrupts the heart’s ability to pump blood effectively, and sustained VT can lead to cardiac arrest. The waveform appears wide, tall, and uniform, indicating that electrical impulses originate from the ventricles rather than the normal conduction pathway.
Ventricular Fibrillation: Chaotic, Life-Threatening Rhythm
Ventricular fibrillation (VFib) is one of the most critical cardiac emergencies. The ventricles quiver instead of contracting properly, producing a completely disorganized waveform with no recognizable P waves, QRS complexes, or T waves. The ECG shows rapid, irregular, low-amplitude activity resembling electrical noise. Without immediate medical intervention, including defibrillation, ventricular fibrillation leads to collapse and death because the heart cannot circulate blood.
Asystole: Flatline or Absence of Electrical Activity
Asystole represents the absence of cardiac electrical activity—essentially a flatline on the ECG. The tracing may show minimal residual movement, but there are no organized waves or contractions. Asystole indicates that the heart has stopped functioning, requiring immediate resuscitation efforts. Unlike ventricular fibrillation, asystole cannot be corrected with defibrillation but instead requires CPR and medications to attempt restarting electrical activity.
Why Recognizing Different ECG Patterns Is Essential
Each arrhythmia carries unique implications for heart function and patient health. Understanding these patterns helps clinicians diagnose conditions early, monitor treatment, and respond to emergencies quickly. From mild rhythm irregularities to life-threatening disturbances, ECG graphs provide a window into the electrical behavior of the heart. Their ability to differentiate between normal and abnormal rhythms makes electrocardiography one of the most valuable tools in cardiovascular medicine.
A Vital Tool for Monitoring Heart Health
The heart’s electrical system is essential for maintaining coordinated contractions and effective blood circulation. ECG rhythm interpretation reveals how well this system operates and highlights when it is malfunctioning. By identifying various types of arrhythmias—normal, fast, slow, or chaotic—ECG patterns guide decisions that can save lives and improve long-term cardiac health.