Growth Bar Chart – Understanding Business Expansion, Financial Performance, and Market Progress Through Data Visualization
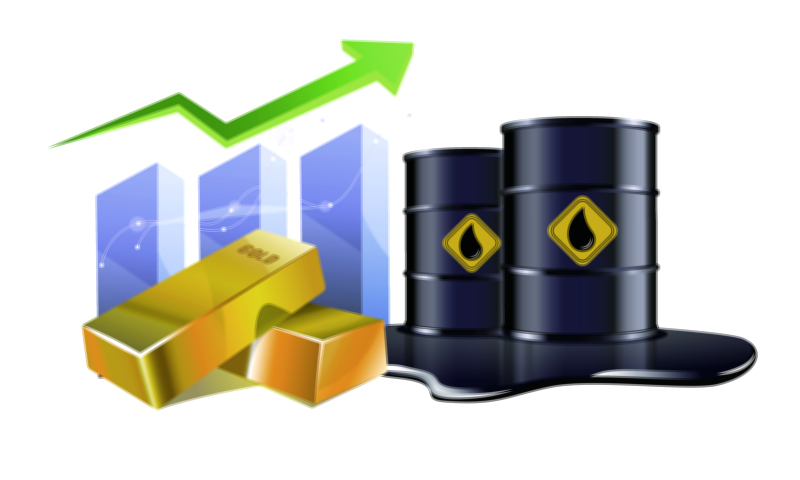
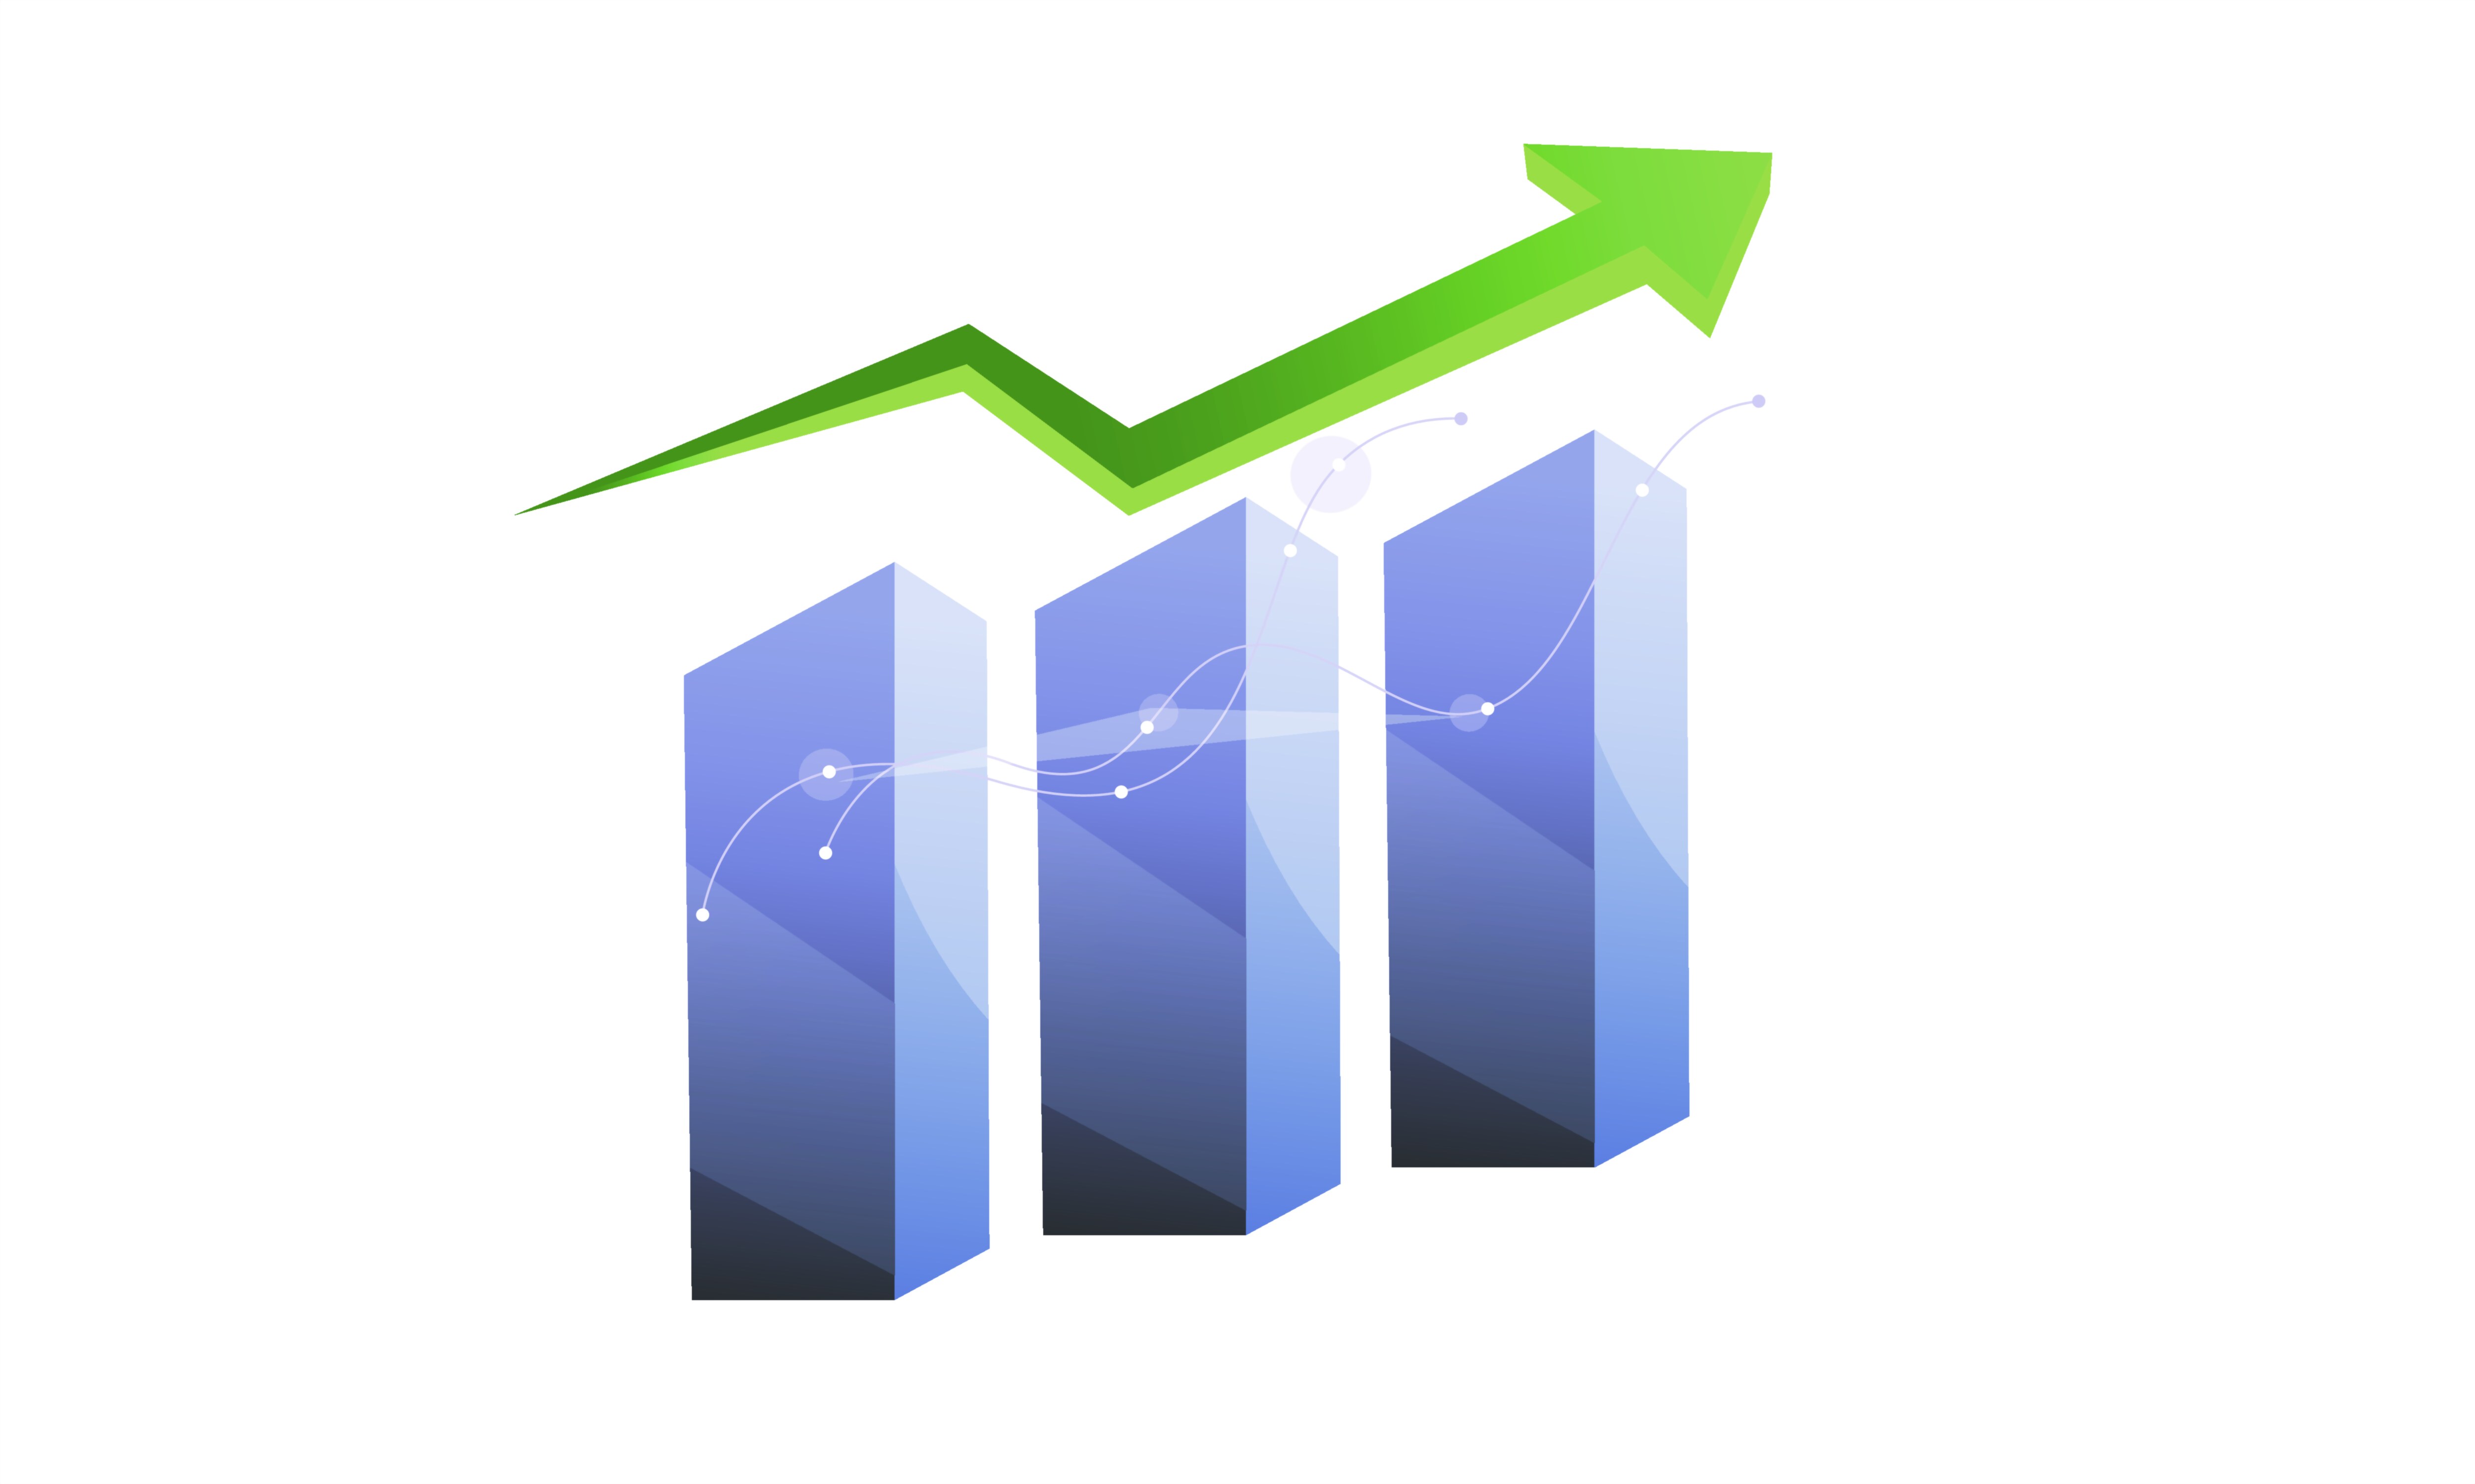
A growth bar chart has become one of the most recognizable and widely used symbols in business, finance, and strategic planning because it visually transforms numerical performance into an intuitive and instantly understandable story of progress. When created as a vector illustration, the upward-rising bars, gradient shading, crisp geometric edges, and dynamic directional arrows represent much more than graphical decoration; they communicate the essence of business evolution, the success of strategic decisions, and the health of financial performance over time. Even before reading the accompanying text or numeric labels, viewers instantly recognize what the illustration expresses — a steady upward movement, increasingly strong results, improving output, and the positive direction of growth. In reports, presentations, dashboards, and analytic documents, such vector artwork becomes a universal visual language that compresses complex financial data into a meaningful and confident message: the organization or investment strategy is moving forward.
The reason the growth bar chart is so useful in business analysis lies in the psychology of human perception. Financial data, when presented in raw numerical form, is difficult for the mind to interpret quickly. Long tables of figures create cognitive overload, forcing the viewer to calculate differences manually before forming impressions about performance trends. A bar chart eliminates this friction by shifting interpretation from logical calculation to visual recognition. People understand the message not by reading but by seeing. The increasing height of each bar, the widening margins between older and newer performance segments, and the direction of the graph enable the brain to determine instantly whether the business is expanding, stagnating, or declining. In a digital era where decision-making moves rapidly and attention spans are limited, this transformation of numbers into visual meaning is essential for business clarity, stakeholder communication, and strategic alignment across teams and departments.
In practical financial terms, a growth bar chart is a snapshot of how effectively an organization converts its vision into measurable results. Each bar on the chart represents a time period — monthly sales figures, quarterly profits, annual revenue, customer acquisition counts, website traffic, operational output, or market share percentages. As the bars rise with time, they tell the story of a company learning, adapting, optimizing, and scaling its capabilities. The upward progression of the bars reflects numerous invisible internal forces: development of stronger products, expansion of marketing reach, better cost management, improved customer service, competitive adaptability, smarter hiring, or innovations in technology and operations. The illustrated chart is simply the visible surface of countless internal efforts performed by teams across the business ecosystem. It stands as both a report of success and a motivational milestone for future ambitions.
In the world of investment and financial markets, growth bar charts carry equal importance. They signal performance reliability, earnings stability, market strength, and strategic viability to investors, analysts, and traders. When shareholders and financial institutions evaluate companies, one of the first visuals they look for is a chart that reflects steady upward growth rather than unpredictable volatility. A reliable upward trend implies that the business model is sustainable rather than dependent on one-time breakthroughs or temporary market conditions. As such, growth bar charts appear throughout investor pitch decks, quarterly earnings reports, investment newsletters, and financial dashboards because they encapsulate the economic fate of a company in a condensed and confidence-inspiring visual form. Even when short-term fluctuations occur, the long-term shape of the growth chart communicates whether the organization is on a trajectory of expanding value.
At the organizational level, bar charts also guide internal decision-making and continuous improvement. Business leaders monitor growth patterns to evaluate whether strategies applied last quarter or last year have yielded desired outcomes. If bars increase sharply after launching a new marketing campaign, optimizing pricing, improving product distribution, training sales teams, or expanding into global markets, these decisions are reinforced. If bars flatten or decline, they send a clear message that adjustments must be made. The bar chart becomes the mirror in which the business sees the consequences of its decisions, not in vague conceptual terms, but in visible measurable form. By visually revealing performance, the chart motivates cultural discipline and prevents businesses from drifting without awareness of long-term trends.
In addition to financial metrics, growth bar charts can highlight non-monetary performance factors that influence long-term organizational success. Customer satisfaction scores, employee retention rates, productivity levels, website engagement, manufacturing efficiency, supply chain optimization, and brand awareness metrics all become more meaningful when translated into upward bar formations. They remind organizations that sustainable success is not driven solely by revenue, but by overall performance in customer experience, workforce strength, operational efficiency, and market relationships. Executives and analysts frequently use growth bar charts to unite all teams — finance, marketing, sales, operations, HR, customer support, and leadership — by showing how contributions from different departments influence shared growth, fostering collaboration rather than isolated departmental thinking.
What makes a vector illustration of a growth bar chart particularly valuable is its level of clarity and scalability. Because vector graphics are composed of mathematical paths rather than pixel grids, they maintain crisp edges and perfect precision whether printed on a billboard-sized report, resized inside a mobile dashboard, or inserted into boardroom presentations. In a business environment where data visualization appears in both digital and print contexts, maintaining sharpness, vividness, and professional quality at all sizes is a critical advantage. The clean geometry of a vector bar chart also reinforces feelings of order, reliability, and structured professionalism, which is why companies use these graphics in both internal and external communications. A polished vector chart visually reinforces the credibility of the data and the stability of the organization.
The presence of an upward bar chart in business materials does more than communicate performance — it shapes stakeholder expectations and emotional responses. Employees feel a sense of accomplishment seeing the visual record of their efforts reflected in rising bars. Customers and partners feel greater trust in a brand whose performance is illustrated with clear growth patterns. Investors and analysts feel validated when growth visuals align with financial projections and earnings milestones. Even individuals outside the business world — students, entrepreneurs, or small business owners — see a growth bar chart and instinctively understand its meaning: improvement is happening, momentum is building, and the future looks promising. It is a visual summary of discipline, learning, perseverance, and adaptability.
Ultimately, the Growth Bar Chart Vector Illustration for Business and Financial Analysis is a symbol of aspiring upward movement — the concept that progress is not random but earned through consistent effort, smart decisions, and strategic vision. It condenses the essence of business into a visual metaphor: growth is not just a goal, but a measurable journey. Every bar standing taller than the one before it tells the world that the organization or individual behind it refused to remain static, learned from challenges, and pushed persistently toward better results. In the realm of business communication, few graphics carry such universal meaning and emotional power, and fewer still can represent the story of progress so quickly and convincingly.